
Observability Monitoring Post #7781 · source on Telegram
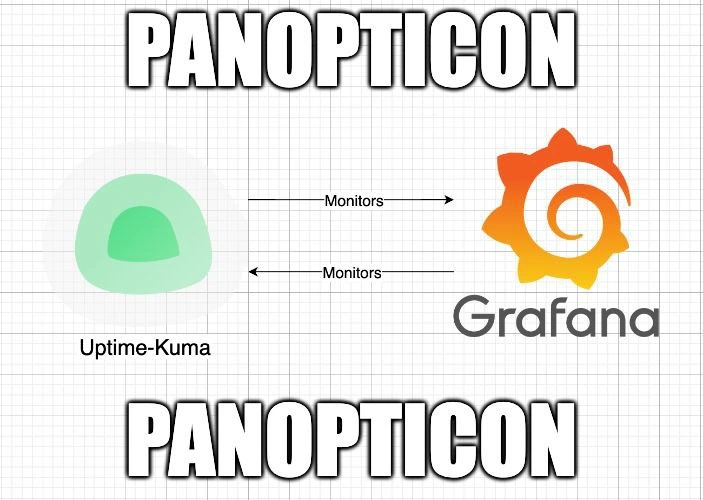
Panopticon: Uptime-Kuma and Grafana Monitoring Each Other
Description
A diagram-style meme on grid paper background with bold white impact-font text 'PANOPTICON' at top and bottom. In the middle, the Uptime-Kuma logo (a green kawaii blob, labeled 'Uptime-Kuma') and the Grafana logo (orange spiral flame, labeled 'Grafana') are connected by two opposing arrows, each labeled 'Monitors' - Uptime-Kuma monitors Grafana, and Grafana monitors Uptime-Kuma. The meme satirizes circular monitoring architectures in self-hosted/homelab setups: each observability tool watches the other, invoking Bentham's panopticon (and 'who watches the watchmen') while guaranteeing that if both go down together, nobody gets alerted
More like this
More like this in Observability Monitoring →
Use J and K for navigation
Comments
5Comment deleted
Perfect mutual observability: when the power strip dies, both dashboards report 100% uptime forever
Who monitors the monitors? The monitors—because trust is not an SLO.
Human design, huh ? Comment deleted
Me when Comment deleted
> learns the language > tries doing their first serious project Comment deleted