
Circular Monitoring Meme Explained
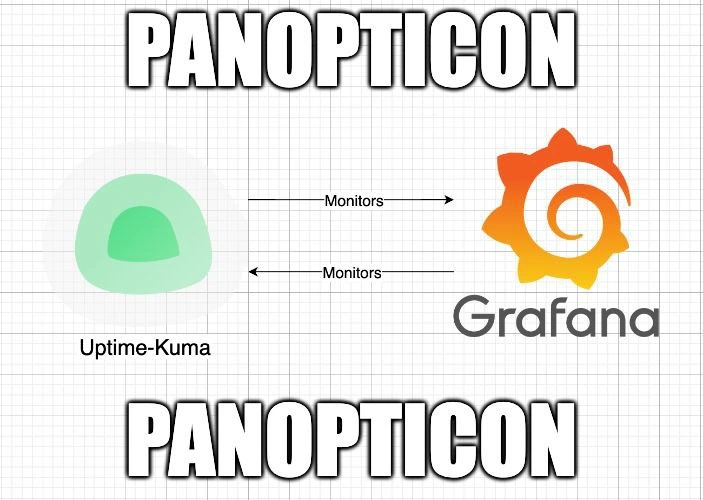
A panopticon diagram shows Uptime-Kuma and Grafana mutually monitoring each other. The dive explains correlated failure on shared hosts, why silence can mean death not health, and why serious alerting lives outside the blast radius.
Level 1: Two Guards Guarding Each Other
Imagine a museum with exactly two security guards, and their entire job is to watch each other — not the paintings, just each other. "Is Bob okay? Yep. Is Dave okay? Yep." It feels very secure until the night both of them fall asleep at the same time, and there is no one left to notice, because noticing was their job. The funny part is how official it all looks — arrows, labels, a fancy word like PANOPTICON in big letters — wrapped around a plan with a hole in the middle big enough to drive a truck through.
Level 2: The Tools on the Whiteboard
- Uptime-Kuma is a beloved self-hosted uptime monitor: it pings your services on a schedule, shows green/red status tiles, and sends notifications when something stops responding. The friendly green blob in the image is its actual logo.
- Grafana is the standard dashboarding tool for visualizing metrics — graphs of CPU, memory, request rates — usually fed by a metrics database. The orange spiral is its logo.
- A healthcheck is a simple "are you alive?" request one system sends another. The arrows labeled
Monitorsmean each tool is performing healthchecks on the other. - A single point of failure (SPOF) is any component whose death takes the whole capability down. The twist here: the pair is the SPOF, because they share everything except a logo.
This is a rite of passage in the homelab world. You spin up services in Docker, then realize you'd like to know when they crash. So you install a monitor. Then you wonder what happens if the monitor crashes — so you point the other tool at it. Congratulations: you've recreated this diagram. The lesson juniors eventually learn is that monitoring must live outside the thing it monitors, the same way you don't store the fire extinguisher inside the fireplace.
Level 3: Quis Custodiet Ipsos Dashboards
Framed top and bottom by PANOPTICON in classic impact font, the diagram on grid paper is austere: the kawaii green blob of Uptime-Kuma on the left, the orange flame-spiral of Grafana on the right, and two opposing arrows between them, each labeled Monitors. That's it. That's the architecture. And every homelab operator who has drawn this exact topology at 1 AM feels personally indicted.
The Bentham reference is doing clever double duty. The original panopticon was a prison design where one unseen watchman could observe all inmates — asymmetric, centralized surveillance. The meme's version is a two-node panopticon, which is philosophically self-defeating: when the watchers watch only each other, you've built not total observability but a closed loop of mutual reassurance. It's "who watches the watchmen?" answered with "the other watchman," which is the same answer as "nobody" wearing a trench coat.
The engineering failure mode is precise and well-known: correlated failure. Mutual healthchecks protect you beautifully against exactly one scenario — a single tool dying while the other survives. But in a self-hosted setup, both containers typically share the same Docker host, the same power strip, the same residential ISP, the same docker-compose.yml. The dominant failure modes — host reboot, disk full, network outage, that one apt upgrade — take out both simultaneously, and a dead monitor sends no alerts. Silence is indistinguishable from health. This is why serious SRE practice insists the alerting path be out-of-band: an external probe service, a different cloud, at minimum a different machine. Dead man's switch patterns exist precisely for this — invert the signal so that the absence of a heartbeat triggers the page, from somewhere outside the blast radius.
The deeper satire is about observability theater. Wiring Kuma and Grafana to watch each other feels rigorous — arrows on a diagram, green status pages, dopamine — while the actual reliability gained rounds to zero. It's the monitoring equivalent of two people agreeing to wake each other up for a flight, then sharing a bed.
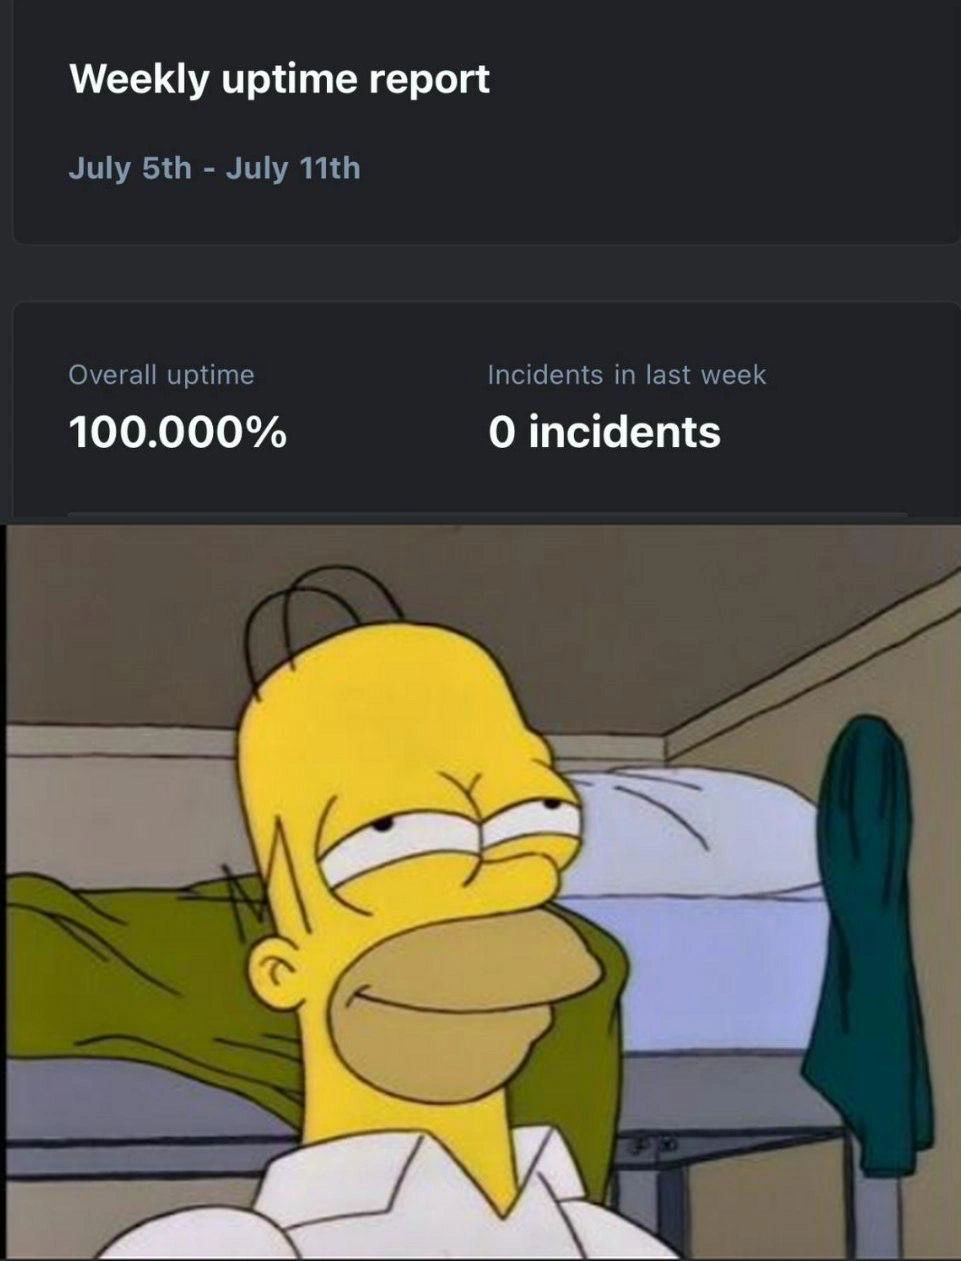
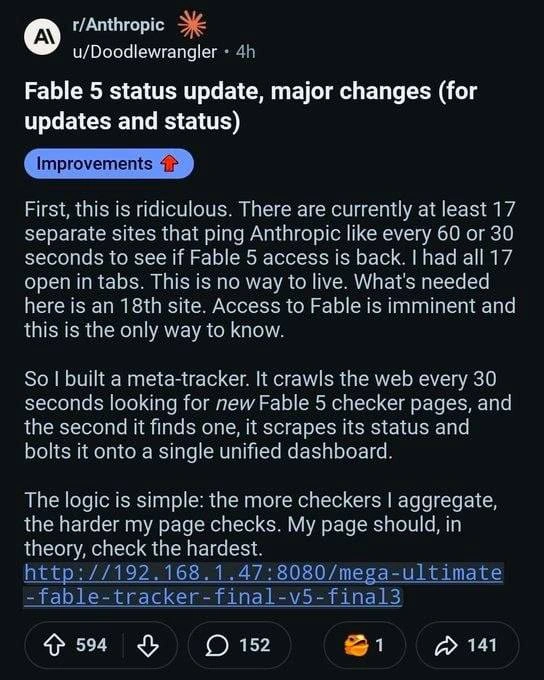
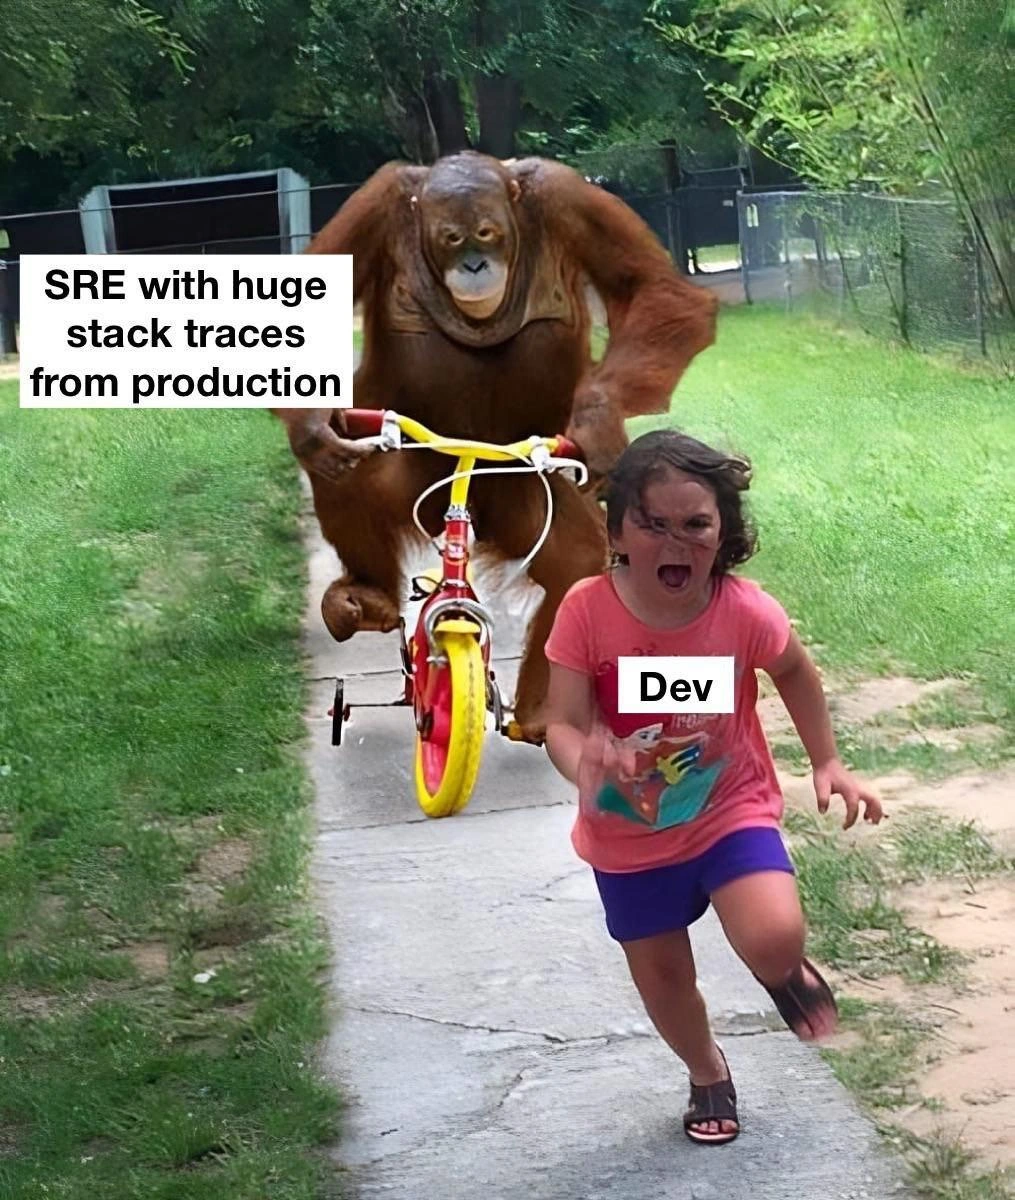
Perfect mutual observability: when the power strip dies, both dashboards report 100% uptime forever
Who monitors the monitors? The monitors—because trust is not an SLO.
Human design, huh ?
Me when
> learns the language > tries doing their first serious project