Skip to content
DevMeme
6556 of 7435
Node.js Event Loop Utilization Drops 80% to 20% by Removing Logs
Performance Post #7184, on Sep 30, 2025 in TG

Node.js Event Loop Utilization Drops 80% to 20% by Removing Logs

Why is this Performance meme funny?

Level 1: Extra Steps Slow You Down

Imagine you’re doing your homework, and after every problem you solve, you have to run and tell the teacher “I finished another one!” before starting the next problem. That would make your homework take a lot longer, right? You spend more time getting up and talking than actually solving problems. If you just quietly solved all the problems and only told the teacher at the end, you’d be done much faster. In this picture, the computer program was doing something similar: it was trying to get work done, but it kept stopping to write notes about its work every single time. Those notes (called “logs”) were slowing it down a ton. When the program stopped writing so many notes, it suddenly could get its work done much more quickly. The funny part is realizing the program was basically tripping over its own shoelaces – it got in its own way by being too chatty. So the meme is joking that the simplest way to speed things up was just to stop constantly pausing to say “I did this and I did that”. Sometimes, less talking (or less logging) means more getting stuff done!

Level 2: Console.log Overload

If you’re a newer developer, here’s what’s going on: Node.js is a runtime where everything runs on one main thread called the event loop. Think of the event loop as a single busy waiter handling all tasks one after another. In Node, tasks like handling incoming requests, reading files, or even printing to the console all go through that one waiter (the event loop). Normally, Node is designed for non-blocking I/O, meaning it can juggle tasks efficiently by offloading some work and not waiting idly. But certain operations can still block that loop if used unwisely. One sneaky culprit is excessive logging with console.log.

Logging means writing out messages (like “User X logged in” or “Function Y started”) to a console or file so that developers can monitor what the application is doing – that’s part of Observability and Monitoring. It’s super useful for debugging and understanding program flow. However, printing text to the console is relatively slow compared to calculating things in memory. When you call console.log in Node, especially in a tight loop or for every request, you’re doing a lot of work writing to the output. If those log writes happen faster than the system can actually output them, Node will start to get bogged down. This is because Node doesn’t spawn a new thread just for logs; the main thread handles it. Imagine our single waiter not only has to serve customers (real work) but also has to write each order in a big ledger (logs). If the waiter spends too much time writing, the customers start waiting longer for their food.

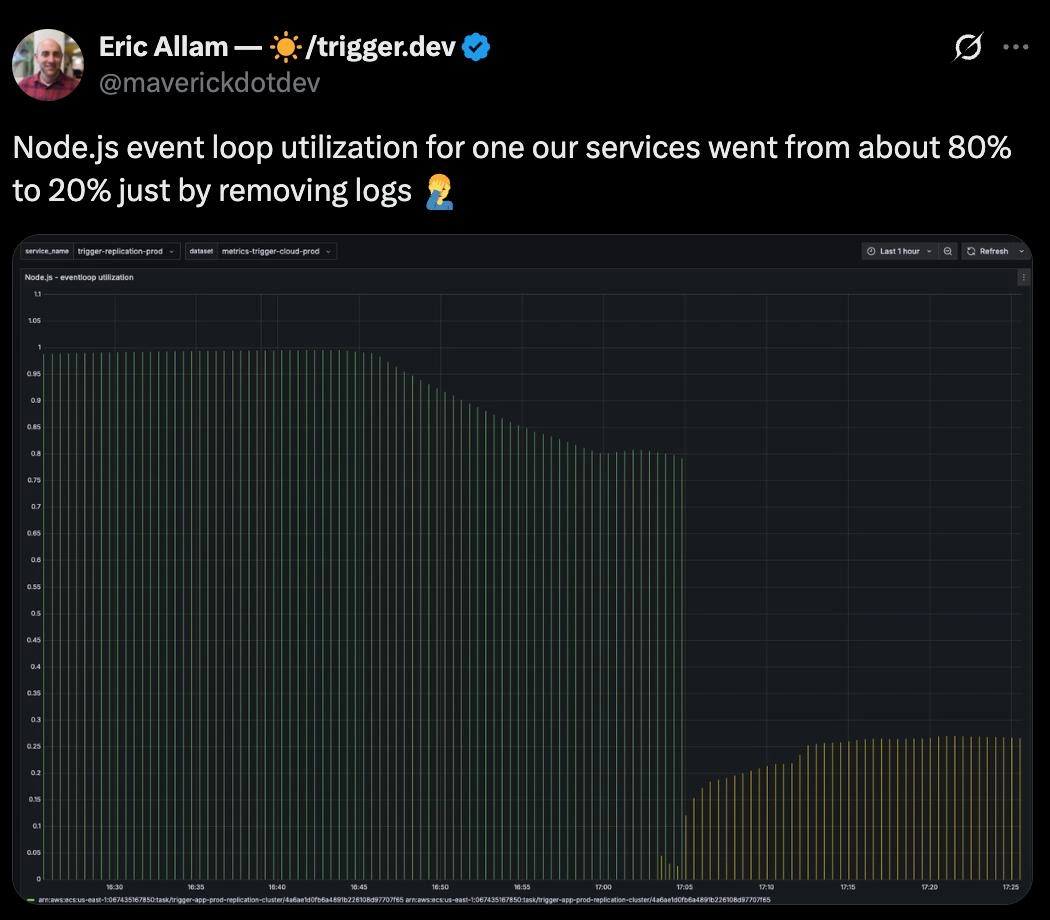
In the tweet’s story, one service had its event loop utilization around 80%. Event loop utilization is basically a measure of how busy that Node thread is – 80% means it was busy doing something 80% of the time (which is quite high, almost like your CPU running at 80% usage constantly). After the team removed a bunch of console.log statements, that utilization dropped to 20%. This indicated that the service wasn’t actually working super hard on real tasks; it was mostly busy printing messages! By removing the log calls (the extra chores), the Node process suddenly had a lot more free time (idle) – now it was only 20% busy, meaning it was mostly idle and could handle more real work if needed. Their Grafana dashboard (a web UI for viewing metrics over time) showed this change in a bar chart: initially tall bars (~0.8) meaning high usage, then after the change, much shorter bars (~0.2) meaning low usage. The bars even changed color (from green to yellow) perhaps to indicate a different range or new deploy – but the key is the height drop.

So essentially, the program was slowed down by too many logs. It’s like if you had a script that calculates something quickly in a loop, it might run in a second or two. But if you add a console.log inside that loop (to print every iteration), it could take much, much longer because the program spends most of its time printing to the terminal. We call that overhead – extra work that isn’t part of the main goal but comes from supporting tasks. Logs are overhead. A little overhead is fine, but here it piled up. This became a performance issue: the extra logging made the service less efficient. In a microservice architecture, people often talk about one service being a bottleneck (slowing others down). In this joke, they’re saying the biggest bottleneck behaved like an internal “microservice” called console.log – basically making fun of the idea that printing text became the slowest part of an otherwise fine system.

For a junior developer, the take-away is: be mindful of where you put logging or any heavy I/O in your code, especially in Node.js. Too much console output can clog up your single processing thread. There are ways to mitigate this (for example, collecting logs and writing them out less frequently, or using asynchronous logging libraries), but the simplest lesson is don’t log every single thing in a tight loop or critical path. It’s a classic newbie mistake to leave a console.log inside a function that runs thousands of times and wonder why the program is slow. This meme is a big-scale version of that same lesson, happening in a real production service! The developers were likely surprised that something as innocuous as logging was eating up the majority of their CPU time. Thanks to their monitoring tools (Grafana showing metrics like event loop usage), they caught it and fixed it by just removing or reducing those logs. It was a quick fix that led to a huge performance optimization. And now it’s a funny story: the code ran 4 times faster simply because it stopped talking so much to the console.

Level 3: The Logjam Bottleneck

At first glance, this tweet’s graph looks like a dramatic performance incident – but it's actually a facepalm-worthy tale of self-inflicted slowdown. In a modern Backend microservice, you expect bottlenecks from databases or network latency. Here the punchline is that console.log – yes, plain old logging – became the highest-latency "service" in the system. The Node.js process was so busy printing debug lines that it nearly choked its single thread. The Grafana screenshot titled "Node.js – eventloop utilization" shows tall green bars hovering around 0.80–0.95 (80–95%) for most of the hour, then abruptly dropping near zero and resuming at about 0.20 (20%) in shorter yellow bars. That drop wasn’t a graceful optimization or a new caching layer – it was simply someone removing logs from the code! 🤦‍♂️

For seasoned NodeJS developers, this is both hilarious and painfully relatable. Node’s event loop is single-threaded, which means it handles one thing at a time (aside from certain asynchronous I/O operations under the hood). When the event loop is nearly 100% utilized, it’s essentially busy all the time and can barely keep up with incoming work. Here the event loop utilization metric (a fancy observability measure introduced in newer Node versions) was around 80%, suggesting the service was straining. That ordinarily signals heavy computation or inefficient code. But the twist: the culprit was excessive logging I/O. Writing to stdout was hogging the loop, leaving only 20% for actual app logic! In essence, the observability tool (logging) was so overused that it devoured capacity, masking the real workload’s lightness. The humor lies in treating console.log like a misbehaving microservice – as if your logging calls were an external service with terrible latency slowing everything down.

Why is this so believable? Because logging I/O can be surprisingly expensive. Each console.log has to format the message and write it to the output stream (often a file or console). In NodeJS, writing to process.stdout can block the event loop when output is too frequent or the stream’s internal buffer is full – this is known as logging backpressure. If the code dumps tons of log lines (for example, logging every request or array element in a loop), the event loop spends most of its time shuffling those messages out to the OS rather than executing real business logic. It’s like a restaurant where the chef spends 4 out of 5 hours calling out order numbers instead of cooking food. In this meme’s scenario, as soon as they disabled those chatty logs, the event loop’s workload dropped to 20% – revealing that 60% of the CPU busy time was pure overhead from logging. The Grafana chart’s dramatic cliff dive visualizes this quick win optimization: remove the logjam, and performance instantly improves fourfold. Talk about a low-hanging fruit fix!

This highlights a common PerformanceOptimization lesson in back-end engineering: too much instrumentation can become a performance issue of its own. We love good Observability (logs, metrics, dashboards) to monitor services, but there’s a runtime cost for that visibility. Here, the cost was so high it became a system bottleneck. Seasoned devs might chuckle because they’ve seen similar issues — an innocuous debug flag left on in production, or verbose logging turning an otherwise snappy service into a sloth. Many such cases indeed: teams often scramble to scale servers or blame Node’s runtime, only to discover the easiest fix was dialing back the logs. In microservices, we joke about “it’s always DNS or the database,” but sometimes it’s just printing text to the console that’s holding your system hostage. The facepalm in the tweet says it all: the team achieved a 4x throughput boost literally by commenting out print statements. Lesson learned (again): don’t let your observability tools become the enemy of your throughput.

Key factors at play:

  • Node’s Single Thread – Node.js runs JavaScript on a single main thread using an event loop. If that loop is tied up with a task (like writing log lines), other work waits. Unlike multi-threaded systems that could offload logging to another core, Node will make your code stand in line behind logging I/O.
  • console.log Overhead – Writing to the console isn’t “free.” Under the hood, console.log ultimately calls process.stdout.write(), which can block if the writable stream can’t keep up. High-volume logs produce I/O backpressure: the output buffer fills and Node must wait (pausing your JavaScript execution) until the kernel or log aggregator catches up. It’s like a traffic jam (a logjam, literally) in the event loop’s highway.
  • Event Loop Utilization Metric – The graph in the meme is measuring how busy the Node event loop is over time. Near 1.0 (or 100%) means the loop is maxed out (doing something every tick, with no idle time). Near 0 means it’s mostly idle. By observing this metric on a Grafana dashboard (common in Monitoring setups), the team noticed a huge drop after a change. That change was removing the logging calls. The metric helped pinpoint that something was monopolizing the CPU – and turned out it wasn’t the business logic at all.
  • Quick Win Fix – Deleting or reducing the console.log statements is about the simplest code change imaginable, yet it had a massive effect. No complex refactor, no scaling hardware, just less noise. It’s a reminder that before diving into elaborate optimizations, check for inadvertent inefficiencies like debug logs left running amok. Sometimes the biggest PerformanceOptimization is nixing unnecessary work.

In summary, this meme hits on a truth that rings true with anyone who’s battled production performance: sometimes your system isn’t slow because of what it’s supposed to be doing, it’s slow because of the extra stuff you added for insight or convenience. The result is equal parts amusing and educational – you can practically hear the groans and laughter from developers reading that tweet, all recalling the day they realized their logging was the hottest code path in the app. Many such cases, indeed.

Description

A tweet by Eric Allam (@maverickdotdev) from trigger.dev stating: 'Node.js event loop utilization for one our services went from about 80% to 20% just by removing logs' with a facepalm emoji. Below is a Grafana-style monitoring chart showing 'Node.js - eventloop utilization' over time. The graph clearly shows utilization around 0.95-1.0 (near 100%) that dramatically drops to approximately 0.25 (25%) at a specific point. The data is from trigger-replication-prod service on AWS ECS (arn:aws:ecs:us-east-1). The chart covers roughly 16:30 to 17:25 timeframe, with the dramatic drop occurring around 17:00

Comments

30
Anonymous ★ Top Pick console.log('why is the event loop blocked?') was literally the answer to its own question
  1. Anonymous ★ Top Pick

    console.log('why is the event loop blocked?') was literally the answer to its own question

  2. Anonymous

    The fastest code is the code that doesn't run. The second fastest is the code that doesn't log every single action to stdout in a blocking, single-threaded event loop

  3. Anonymous

    Turns out our hottest code path wasn’t business logic at all - it was printf debugging in production

  4. Anonymous

    The classic senior engineer moment: spending weeks optimizing database queries and implementing caching layers, only to discover your junior's console.log('HERE!!!') in a hot path was the actual bottleneck. Sometimes the most sophisticated monitoring systems just reveal the most embarrassing truths

  5. Anonymous

    Ah yes, the classic 'console.log() as a service' architecture pattern. Nothing says 'I care about observability' quite like synchronously blocking your event loop to write to stdout that nobody's reading anyway. At least now they have empirical proof that their logs were more expensive than their actual business logic - a 4x performance improvement just by admitting that maybe, just maybe, logging every single event in a high-throughput Node.js service wasn't the architectural flex they thought it was. The real kicker? Somewhere, a senior architect is updating their resume to include 'Achieved 300% performance improvement through strategic I/O reduction' while conveniently omitting the part where they were the one who approved logging everything in the first place

  6. Anonymous

    Profiler optional: in Node, grep -v 'console.log | commit' is the real hot path optimizer

  7. Anonymous

    When deleting console.log buys you 60% headroom, you didn’t have a Node service - you had a log shipper with a side hustle as an API

  8. Anonymous

    If your hottest code path is console.log(), you didn’t build a microservice - you built a diary. Deleting prose dropped ELU by 60%; turns out the event loop hates storytelling

  9. @Aqualon 9mo

    logs are always really heavy, aren’t they?

    1. @chupasaurus 9mo

      Only for Node😂

    2. @pulsar_sp 9mo

      same thought still, 3/4 of the load looks hilarious

    3. @dsmagikswsa 9mo

      shouldn't it an async process?

  10. @draemort 9mo

    I hope they don't mean console.log calls

    1. @pnlt_s 9mo

      You're saying it like there's a library dedicated just for logging

      1. @azizhakberdiev 9mo

        it's node

  11. @mrYakov 9mo

    probably not because of logs itself, but because of custom formatting of nested structures

  12. @casKd_dev 9mo

    good logging is cheap

  13. @Valithor 9mo

    Async or not doesn't really matter

  14. @azizhakberdiev 9mo

    there are libraries for importing libraries

    1. @TheFloofyFloof 9mo

      C has those too

  15. @digital_insanity 9mo

    But... don't you need logs?

    1. @azizhakberdiev 9mo

      there are different ways of doing that

  16. @digital_insanity 9mo

    I mean To utilize event loop isn't necessarily bad thing, is it? JS boys, correct me if I'm wrong

    1. @ZgGPuo8dZef58K6hxxGVj3Z2 9mo

      The event queue is the main thread. If it is 100% utilized on the core it runs on then even if you get more requests you wont be able to utilize the other cores even if you have like 255 more not being used TLDR: major bottleneck

      1. @digital_insanity 9mo

        But...wait Isn't that a work of scheduler to ensure that tasks are dispatched to multiple threads? Sorry if noob question, I'm from .NET background

        1. _ 9mo

          There's some tasks you can only do from the main thread (typically UI stuff). Then it's the programmer's responsibility to make task that can only run on the main thread as small as possible, while allowing other work to run on other threads

          1. _ 9mo

            That's for .NET / C# / Java and the like actually. If we're talking about JavaScript, in fact it's single-theaded and more or less will always be

        2. @ZgGPuo8dZef58K6hxxGVj3Z2 9mo

          An event queue is always single threaded and JavaScript isnt even multithreaded it can only handle async stuff but async isnt multithread its still even queue based

  17. @deadgnom32 9mo

    yes

  18. @hillary314 9mo

    You can use web workers to simulate multithreading but it's overkill for logs, doing logging async is asinine imho, they must have used something like colored logs or some other bs

Use J and K for navigation