The Irrational Triangle of Debugging
Why is this Debugging Troubleshooting meme funny?
Level 1: Read the Instructions
Imagine a kid trying to build a new LEGO toy without looking at the instructions. They keep trying to force the same two pieces together in the wrong way, over and over, hoping this time it will magically fit. When that doesn’t work, they start randomly shuffling through other LEGO pieces, guessing where each one might go. Meanwhile, the instruction booklet – which clearly shows the right way to build the toy – is lying right there on the table, unopened. Eventually the kid gets so frustrated that they stop and take a little break. Maybe they even start talking out loud, saying “Why won’t this work? I’ve tried everything!” – perhaps to a pet or a favorite toy – just venting their problem. In doing so, they suddenly realize they’ve been using the wrong piece all along. Finally, they crack open the manual and follow the step-by-step guide. Lo and behold, the toy comes together perfectly in just a few minutes. It’s a bit funny to watch, because the solution (reading the instructions or taking a moment to think differently) was available the whole time, but the child was stuck in a loop of doing the same thing and getting nowhere. This is exactly what the meme is joking about: sometimes we ignore the simple, effective solutions that are right in front of us and instead keep trying the not-so-effective things over and over, just hoping for a different result.
Level 2: Ducks, Docs, and Debuggers
Let’s break down each of the debugging tactics shown in the chart and what they mean in practice, especially if you’re new to coding:
Take a walk: Sometimes the best way to solve a coding problem is to step away from the keyboard for a few minutes. This might mean taking a short walk, grabbing a coffee, or just doing something else briefly. It sounds unrelated to programming, but clearing your head can help you see the issue with fresh eyes. It’s like hitting the reset button on your brain. Often, when you come back to your desk, you suddenly spot the problem or think of a new approach. That’s why “taking a walk” is shown as very effective (it often leads to breakthroughs), even though people don’t try it as often as they should.
Talk to a Rubber Duck: This refers to a technique called rubber duck debugging. It means explaining your code problem out loud as if you’re teaching or talking to a rubber duck (or any inanimate object). The idea is that when you try to explain what the code is supposed to do and what it’s actually doing, you often discover the bug yourself. For example, you might say, “Okay, this function should add 5 to each number, but it’s giving me a negative result…” and then suddenly realize, “Oh! I’m subtracting instead of adding!” You don’t literally need a duck – some people just talk to an empty room or imagine explaining it to a friend. It might feel silly at first, but it’s surprisingly effective at untangling your thoughts. The meme shows this as a high-impact trick that developers don’t use as much as they could.
Use breakpoints: Using breakpoints means running your code in a debugger (a special tool in your code editor or IDE – Integrated Development Environment) that lets you pause the program at specific lines. When the code is paused, you can check the values of variables, see which lines have executed, and move through the code step by step. It’s like watching a replay of what the program is doing in slow motion. This helps you pinpoint exactly where things go wrong. Nearly all modern IDEs (like Visual Studio, PyCharm, or VS Code) have debugging features that support breakpoints. Using breakpoints is more structured than just printing out values because you can inspect everything in the moment. The chart suggests breakpoints are pretty effective, but not all developers use them frequently – perhaps because it takes a bit of time to set up, or some beginners haven’t learned how to use the debugger yet. Once you learn it, though, it becomes a powerful way to troubleshoot complex issues.
Read the docs: “Docs” is short for documentation – the official instructions and explanations for a software tool, library, or language. Reading the docs means going to the source (like the official website or manual) to find answers. For example, if you’re using a function from a library and it’s not working as expected, the documentation might have a page explaining how that function works, what parameters it needs, and common pitfalls. Newer programmers sometimes avoid the docs because they can be long or use unfamiliar terms. It’s tempting to just Google the problem and read a quick Stack Overflow answer. But often the documentation contains the exact details you need and is kept up to date by the creators. Reading it carefully can save you from misunderstanding how something is supposed to work. In the meme’s chart, reading the docs is shown as very effective (because it often directly answers your question) and something developers do fairly often (at least the ones who have learned its value). It’s basically saying: “Don’t forget, the manual might already have the solution written out for you.”
1st page of Googling: This refers to checking the first page of results when you search your problem on Google. Let’s say your program hits an error message like “NullPointerException on line 20” – you copy that and paste it into Google. The first page that comes up usually has the most relevant results: maybe a Stack Overflow question where someone had the same error, or a documentation page, or a blog post discussing that exact issue. Developers do this all the time. It’s one of the quickest ways to see if your bug is a known problem and if someone has already solved it. In the chart, 1st page of Googling is shown as both common and pretty effective – which makes sense, because many errors are not unique and someone else online has encountered them. You’ll often find an answer in minutes this way. It’s like asking the internet “Has anyone seen this before?” and usually getting a useful answer right away.
5th page of Googling: If you find yourself on page 5 of Google results, it means the first few pages didn’t have what you needed, and you kept clicking “next page” hoping to find something useful. By page 5, the results can be pretty far off the mark: obscure forum posts from a decade ago, or unrelated topics that just happen to mention some of the same keywords. This usually happens when your problem is either very rare or you’re not searching with the right keywords. It’s generally a sign of growing frustration. In the meme, 5th page of Googling is placed low on the effectiveness scale – implying that digging that deep usually doesn’t yield a solution. Most of the time, if you haven’t found anything useful by page 2 or 3, it might be better to try a different search phrase or consider another approach (like reading docs, or asking a question on a forum) rather than blindly combing through more Google pages. Essentially, the meme is poking fun at that desperate feeling when you click through pages of search results with diminishing hope of finding the answer.
print("HERE!!"): This is an example of using print statements for debugging. The idea is simple: you insert lines in your code that print out messages or variable values to the console (for example,print("got here")orprint("value of x:", x)) at certain points in your program. If you’re not sure whether part of your code is running, you might put aprint("HERE!!")there, so when you run the program you’ll see “HERE!!” in the output, confirming that line was reached. Similarly, printing variable values can show you if a value is what you expect at a given moment. This technique is very common, especially when you’re starting out or if you want a quick-and-dirty way to trace execution. It doesn’t require any special tools – just edit the code and run it. The downside is that it can be tedious: you may have to add and remove a bunch of print statements, and the output can get cluttered. Also, if the bug is in a part of the code you didn’t think to print, you might miss it and have to add more prints and run again. In the chart, theprint("HERE!!")tactic is depicted as not very effective overall (compared to using a debugger with breakpoints), yet many of us try it often. It’s basically saying, “Yeah, we spam print statements a lot, even if it’s not the smartest way.” Still, print debugging does work in many simple cases and can be faster for a quick check than setting up a full debugger, which is why people reach for it out of habit.Run the same code again and hope: This is the habit of re-running your program (or test) without changing anything, just to see if maybe the bug mysteriously goes away. It sounds illogical, and it mostly is! If nothing in the code or environment changed, you’ll likely get the same error or bad result every time. Yet, in moments of frustration, a lot of us hit the “Run” button again thinking “Maybe this time it’ll work…?”. The meme places this at the extreme end: tried very frequently but with almost zero effectiveness. There are a couple of scenarios where running again might appear to help – for example, if the error was caused by something external like a network glitch, a server being temporarily down, or a random timing issue, then maybe the next run succeeds. In software testing, sometimes you have “flaky tests” that pass on one run and fail on the next due to timing, and re-running might pass if you get lucky. But those are special cases. Generally, if you haven’t changed the code, running it again will reproduce the same bug, because computers aren’t magic. This entry on the chart is exaggerating that wishful thinking aspect of debugging: when you’re so stuck you resort to basically hoping for a miracle. It’s funny because every programmer recognizes that feeling, even though we know it’s not a real solution.
Level 3: Hope-Driven Debugging
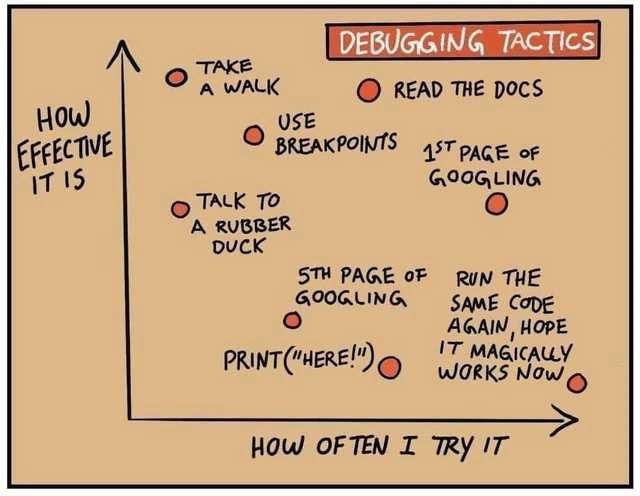
This meme uses a scatterplot to map out debugging tactics by two metrics: how often developers use them (X-axis) vs how effective they are (Y-axis). The joke is that the points form an almost inverse relationship – the strategies we rely on the most tend to be the least effective, while the ones that truly work are used infrequently. For instance, Take a walk sits at the top of effectiveness (clearing your head often gives new perspective) but is plotted far left, meaning devs rarely do it. Attacking a bug fresh after a short break often conjures an “aha!” moment, and the chart reminds us how seldom we exploit that high-yield approach. Rubber duck debugging is another underrated hero high on the effectiveness scale but left-of-center on usage. Rubber ducking means literally explaining your problem out loud (often to a toy duck or an imaginary listener) to force yourself to articulate the logic. Many programmers have experienced the phenomenon where simply describing the bug reveals the solution – the act of verbalizing triggers a realization. Yet, in practice, people skip this step or feel silly talking to a duck, so it’s not used as often as it deserves. (When you’re coding alone at 2 AM with no teammate to bounce ideas off, that little rubber duck on your desk can be a lifesaver in debugging, if you remember to use it!)
Using real debuggers with breakpoints is shown fairly high on effectiveness but only medium on the “how often” axis. Breakpoints let you pause a running program at a specific line and inspect the state (variables, memory, the call stack) at that moment – essentially giving you X-ray vision into your code’s execution. This is a powerful professional tool: you can step through code line by line to find exactly where things go wrong. However, many developers (especially when inexperienced or under time pressure) still default to sprinkling print("HERE!!") statements through their code as a primitive trace. It’s the classic print debugging approach – quick and simple, but messy and limited. Instead of using an interactive debugger, they litter the output with logs like breadcrumbs, hoping to trace the program’s path and find the issue. We’ve all done it: peppered prints in a dozen places to yell “I got here!” or dump a variable’s value. This can work for small problems, but it’s easy to miss things and hard to manage in complex systems. (Ironically, adding a bunch of print statements can even hide certain bugs by changing the timing or memory layout – the infamous Heisenbug scenario where a problem disappears when you try to debug it.) In short, using breakpoints is a more systematic and effective tactic, yet plenty of devs resort to printouts because it’s immediately available in any environment.
Now, look at the two tactics plotted on the upper-right, meaning both frequently tried and highly effective: Read the docs and 1st page of Googling. Reading the docs (the official documentation/manual for a language, library, or API) is often the most direct way to understand how something is supposed to work. “RTFM” – Read The Friendly Manual 😉 – exists as advice because the documentation is usually the authoritative source. A lot of bugs or confusion vanish once you carefully read the relevant section of the docs, which might reveal a misused function or an overlooked detail. Seasoned developers know that investing a few minutes in documentation can save hours of blind trial-and-error. However, in the heat of debugging, many people (especially newer devs) skip the docs, assuming it’s faster to search the error message on the web. That’s why this chart is funny: it suggests Read the docs is actually done fairly often by those in the know, and it’s extremely effective — a bit of truthful encouragement wrapped in humor. Alongside docs, searching the web is every programmer’s go-to move. The 1st page of Googling for an error usually yields something useful: Stack Overflow answers, GitHub issues, blog posts or documentation pages that address your problem. It’s plotted high on both axes because, indeed, devs constantly do this and it usually works. Copy-pasting an error message into Google is practically reflex, and the first page of results often contains the exact hint or solution needed (commonly from Stack Overflow’s vast Q&A archive). It’s a quick win in most cases – if dozens of other devs have hit the same bug, chances are the answer is right there at the top of the search results.
In contrast, consider the 5th page of Googling point, which the meme places much lower on the effectiveness scale. By the time you’re trawling through page 5 of search results, you’re firmly in debugging desperation territory. The first page didn’t have the answer, nor did the second or third… so you kept digging. At this depth, results are usually obscure forum threads, super niche blog posts, or loosely related issues – the quality and relevance drop off steeply. Most developers rarely go that far unless they are truly stuck on an esoteric problem. It’s basically a sign you’re searching for a very rare error or using the wrong keywords. As the chart humorously notes, this strategy isn’t very effective; if an answer was hard to find even on the internet’s front pages, you might need to rethink your approach (perhaps read official docs or ask for help) rather than clicking through endless search pages. Still, we all know the feeling of page-five despair: clicking result after result that almost hits the issue but not quite, hoping the next page will reveal the golden clue. It usually doesn’t.
Finally, the red dot buried in the far bottom-right corner encapsulates the ultimate desperation move: Run the same code again, hope it magically works now. This is humorously portrayed as something developers do way too often despite being essentially pointless. It’s the programming equivalent of hitting the broken TV remote a second time or re-opening a stuck jar and just wishing for a different outcome. Unless your bug is non-deterministic or environment-related (like a timing-dependent race condition or a flaky external service), rerunning the unchanged code will yield the exact same error every time. Veteran engineers chuckle at this because they’ve been there – after hours of failed attempts, you’re tempted to just reboot the app or rerun the test one more time, praying to the code gods for a miracle. In fact, doing the same thing repeatedly and expecting a different result is jokingly referred to as the very definition of insanity – a nod to that famous adage. And yet, in moments of exhaustion, a programmer might think, “Maybe the bug fairy fixed it this time.” Spoiler: it’s almost never fixed. This dot being far right (tried often) and rock bottom on effectiveness perfectly captures the absurdity.
For experienced developers, this entire debugging tactics chart hits close to home. It highlights the gap between what we know we should do and what we actually do when we’re stuck in a debugging rabbit hole. The humor works because it’s painfully relatable: we’ve all ignored our own better judgment out of frustration or impatience. We know stepping away or systematically using a debugger is smart, but in the crunch, it’s easier to panic-Google obscure pages or add fifteen print()s and rerun again. This meme resonates as a shared inside joke about developer behavior and Developer Experience (DX): debugging can be a grind, and humans are not always rational under pressure. It’s a lighthearted reminder (to both juniors and seniors alike) that the most effective fix might be to take a deep breath, RTFM, or consult the rubber duck, instead of brute-forcing and hoping the bug magically evaporates. The chart cleverly encourages us to swap some of those low-yield habits for the proven tactics we often neglect. After all, a calmer, more methodical debugging approach can save a lot of head-against-keyboard moments – and that’s something every developer can appreciate with a smile.
Description
A hand-drawn chart titled 'DEBUGGING TACTICS' on a beige background. The chart is a scatter plot with two axes. The vertical Y-axis is labeled 'HOW EFFECTIVE IT IS', and the horizontal X-axis is labeled 'HOW OFTEN I TRY IT'. Various debugging methods are plotted as red circles. Highly effective but seldom-used tactics in the top-left include 'TAKE A WALK'. Highly effective and moderately used tactics include 'READ THE DOCS' and 'USE BREAKPOINTS'. In the middle are 'TALK TO A RUBBER DUCK' and '1ST PAGE OF GOOGLING'. Towards the bottom right, representing low effectiveness but high frequency, are '5TH PAGE OF GOOGLING', 'PRINT("HERE!")', and, furthest to the right, 'RUN THE SAME CODE AGAIN, HOPE IT MAGICALLY WORKS NOW'. The chart humorously illustrates a common developer anti-pattern: favoring low-effort, often ineffective debugging methods over more disciplined and effective ones. It's a relatable commentary on the psychology of problem-solving under pressure, where developers often choose repetition and hope over stepping back or consulting documentation

Comments
7Comment deleted
The junior developer lives in the bottom-right quadrant. The senior developer lives in the top-left, but still makes frequent nostalgic trips to the bottom-right just to feel something
I added a Prometheus alert on (google_page >= 2); when it fires, Slack reminds me to take the walk that actually fixes the bug
After 20 years in the industry, I've finally accepted that the correlation between debugging technique effectiveness and usage frequency follows an inverse power law - which explains why my git history is 40% 'fixed typo' and 60% 'please work this time'
This chart perfectly captures the senior engineer's paradox: we know breakpoints and documentation are the right answer, yet we still find ourselves on page 5 of Google at 2 AM, adding print statements like breadcrumbs in a forest of our own making. The rubber duck sits judgmentally on our desk, knowing we'll eventually come crawling back after the third 'run it again and pray' attempt fails. It's not that we don't know better - we wrote the debugging guidelines - we're just temporarily convinced that *this time* the code will work differently without any actual changes
Print('here') owns the high-frequency low-efficacy quadrant because after 20 years, we know persistence beats perfection - until the walkaway Heisenbug whisperer appears
Senior debugging truth: rerun-and-hope only “fixes” Heisenbugs by shifting the race window; reading the docs fixes the actual bug - so naturally we do the former ten times more
My debugging pipeline is tracing + docs + a long walk; rerun‑and‑pray only “fixes” Heisenbugs because the race condition times out before my coffee does