Rubber Duck Debugging Scales Horizontally
Why is this Debugging Troubleshooting meme funny?
Level 1: Many Tiny Listeners
This is like trying to solve a hard homework problem by explaining it to a toy on your desk. Usually one toy is enough to help you notice your mistake. In the picture, the problem is so annoying that the programmer has brought a whole row of tiny listeners, hoping at least one of them will somehow know what went wrong.
Level 2: Explain the Bug
Rubber duck debugging is a real programming habit where a developer explains their code step by step to a rubber duck or any patient object. The point is not that the object answers. The point is that speaking slowly makes the developer notice contradictions, missing checks, wrong variable names, or a branch that can never run.
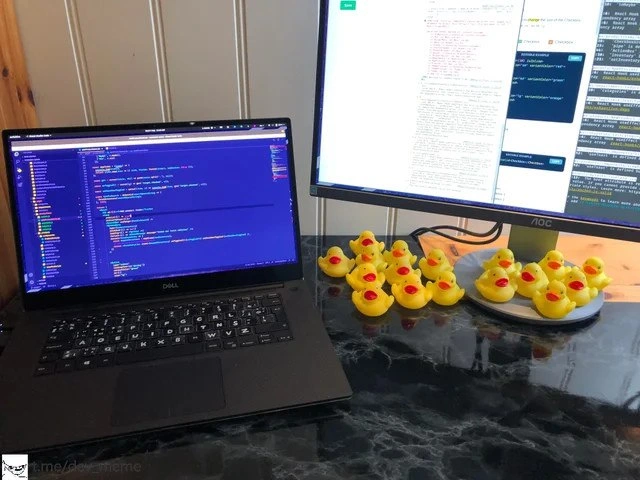
The image shows several familiar pieces of troubleshooting work: an IDE or code editor on the laptop, a larger monitor with browser output and dense log-like panes, and a row of ducks placed right where a developer would look while thinking. Those details connect to Bugs, Debugging_Troubleshooting, and DeveloperExperience_DX because modern debugging is part technical investigation and part emotional endurance test.
For a junior developer, this is very recognizable. At first, debugging feels like finding the one bad line. Later, you learn it may involve reproducing the issue, checking inputs, reading stack traces, comparing environments, and proving that your "obvious" assumption is false. The ducks represent the moment when the tools are open, the code is visible, and the answer is still hiding in plain sight.
Level 3: Quorum-Based Debugging
The desk setup is funny because it takes rubber duck debugging, a deliberately simple technique, and scales it like an enterprise system that lost all sense of proportion. The laptop shows a dark code editor, the external monitor shows a browser and console-like panes, and the desk is lined with many small yellow ducks. One duck is the classic move. This many ducks looks like the developer has escalated the bug to a committee.
The post caption makes the panic explicit:
One of you MUST have an idea?!
That is the shared developer pain point: when a bug survives logs, breakpoints, browser devtools, IDE inspection, and a stern conversation with yourself, you start bargaining with inanimate objects. Debugging often fails not because the toolchain is weak, but because the mental model is wrong. The code is doing exactly what it was told; the problem is that nobody, including the person who wrote it, remembers why it was told that.
Rubber duck debugging works because explaining code out loud forces hidden assumptions into the open. You say, "This function always receives a valid user," and then your own sentence betrays you. The humor here is that the developer has multiplied listeners as if more ducks mean more insight. It is the debugging version of adding more dashboards after an outage: emotionally satisfying, rarely causal, and somehow still cheaper than another meeting.
Description
A desk setup shows a Dell laptop running a dark-themed code editor beside a large external AOC monitor filled with a browser window, terminal-like panes, and dense log or console output. A row of many small yellow rubber ducks is lined up across the desk and monitor base, turning the classic single rubber duck debugging technique into a whole debugging committee. The visible fine-grained code and log text is too small to read precisely, but the screens clearly show active development and troubleshooting work; a faint bottom-left watermark reads "t.me/dev_meme". The humor comes from treating a simple explanatory debugging aid as something that needs horizontal scaling when the bug is stubborn enough.
Comments
1Comment deleted
When one duck cannot reproduce the issue, apparently the next step is a quorum-based debugging protocol.