Advanced Debugger vs. 'One Printy Boi'
Why is this Debugging Troubleshooting meme funny?
Level 1: High-Tech vs Hands-On
Imagine you have a super fancy robot that can tie your shoes for you. It has lots of gears and sensors and it’s very powerful – in theory, it can lace up your shoes perfectly every time by analyzing every tiny detail. Now, imagine on the other side, you have just your own two hands. Who would win in a shoelace-tying contest? The robot is amazing and high-tech, but if you’re in a hurry, honestly, you’d probably use your hands and get it done faster.
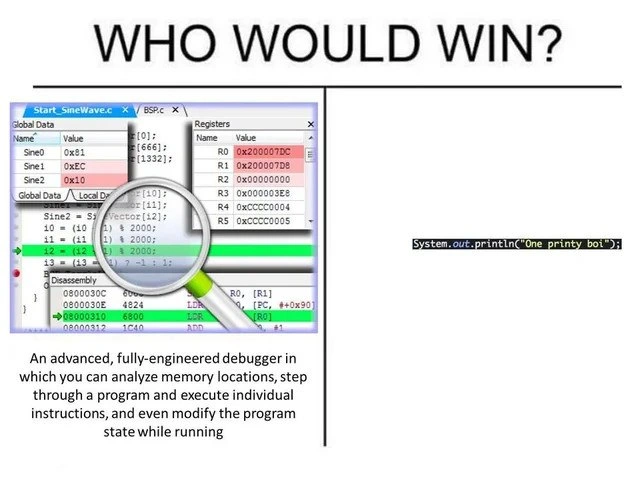
That’s the joke of this meme, but with coding. On one side, there’s an extremely advanced tool (like the fancy robot) that can help a programmer find a bug in their code by inspecting everything very closely. On the other side, there’s a super simple method: just print out a message in the code (kind of like leaving a quick note for yourself to see). The meme asks, “WHO WOULD WIN?” as if these two are in a competition. It’s funny because you’d expect the big fancy tool to win easily – it’s so powerful! – but in real life, programmers often just go with the simple print-out method to solve their problems. The surprise that the tiny, simple solution often beats the complicated one is what makes it humorous. It’s like having a giant cleaning machine for your room but you end up picking things up by hand because it’s faster. The meme makes people laugh and nod because it’s showing a truth in a silly way: sometimes the easiest, old-fashioned way gets the job done better than the expensive gadget, and we can all relate to that feeling.
Level 2: Stepping vs Printing
Let’s break down what’s being compared here in more straightforward terms. On one side, we have using a debugger in an IDE (Integrated Development Environment) to troubleshoot code. On the other side, we have print statement debugging, which is literally adding lines in your code to print out information. Both are common ways to find and fix issues in programs, but they work quite differently.
What a Debugger Does: A debugger is a special tool (usually built into your IDE or available as a command-line program like gdb) that lets you run your program in a controlled way. You can set breakpoints (think of them like red stop signs next to a line of code). When your program runs and hits a breakpoint, it will pause right before executing that line. At that moment, the debugger will show you the current state of the program. You can see the values of variables, and you can usually expand objects to inspect their fields, etc. You can also step through execution line by line (or even instruction by instruction) using commands like "step" or "next" or buttons in the IDE (typically named Step Over, Step Into, etc.). Stepping means the program will execute the next line and then pause again, so you can observe what changed. This is incredibly useful for watching how a loop progresses or how a value changes over time. In the meme’s left panel, the debugger is showing all sorts of info: global variables (like Sine0, Sine1 with some hex values), CPU registers (R0, R1, etc.), and the disassembled machine code of the program. That level of detail is more than most high-level programmers use daily, but it illustrates that the debugger gives you complete visibility into the program’s internals. You could literally see not just that x = 5, but how that 5 is stored in memory or a register, if you needed to.
What Print Statement Debugging Does: This is the more manual, old-school method. You instrument the code with extra lines that output the values you care about. For example, if you want to know if a function is being called, you might put a System.out.println("Reached function X") at its start. If you want to know the value of variable n at a certain point, you add System.out.println("n = " + n). Then you run the program normally (not in a special debug mode). The program won’t pause anywhere, but it will produce the messages you added, in sequence, to the standard output (console, terminal, or log file). After it runs, you look at the output and deduce where things might be going wrong. It’s essentially tracing your program by hand. You might rerun several times, adding more print statements or moving them around to narrow down an issue. It’s straightforward and doesn’t require any special tools beyond the ability to print text. Every programming language has some print functionality, so this technique is universal.
A quick example: Suppose you wrote a loop that should run 10 times, but it seems like it’s running forever (an infinite loop). Using a debugger, you could set a breakpoint inside the loop and count how many times you hit it, or look at the loop variables each time through. Using print statements, you could do something like:
for (int i = 0; i < n; i++) {
System.out.println("Loop iteration i = " + i);
// ... rest of loop ...
}
System.out.println("Loop finished");
If n is 10, you expect to see i = 0 up to i = 9 printed, then "Loop finished". If you see it go beyond, or never see "Loop finished", that tells you something’s off (maybe n wasn’t 10 as you thought, or maybe the loop condition is wrong). In a debugger, you could have learned the same by inspecting i at each break, but the print approach just dumps it out for you to read after the fact. It’s not as interactive, but it certainly works.
Now, the advantages and disadvantages of each approach become clearer:
With a debugger, you don’t need to alter your code with extra lines. You run the program in a special mode and can pause and inspect at will. You can check any variable’s value on the fly, even ones you didn’t anticipate needing. You can also sometimes change values to test hypothetical fixes. The downside is you have to learn how to use the tool, and it might not be available or easy for all types of programs (for example, debugging a live web server or an embedded device can need extra setup).
With print statements, you do modify the code (which you’ll later remove or comment out once done). You only see the data you decided to print — so it might take a few runs to get all the info you need, especially if you guessed wrong about what to print the first time. You don’t get an instant pause; you have to infer what happened between prints. However, prints are extremely easy to add, and they work in any situation. If your program can output text, you can debug this way. You can even leave some print (log) statements in permanently to help understand future issues (many apps have logs for this reason). The print approach also has minimal overhead: it won’t significantly slow down your program or change its timing (except in very timing-sensitive cases). In contrast, running under a debugger can sometimes make a program slower or alter timing, which, as mentioned, might mask certain issues.
To summarize the differences in a simple comparison:
| Full Debugger Tool (Breakpoints) | Print Statement Debugging (Logs) |
|---|---|
| Pauses the program at chosen points (breakpoints) so you can inspect state at that exact moment. | Program keeps running uninterrupted, but prints out information as it goes (you inspect state after the fact, via the log output). |
| No code modification needed to inspect variables (the debugger lets you see any variable anytime). | Requires adding print or log lines into the code for the specific things you want to see (and later removing them). |
| Lets you view many variables, the call stack, and even CPU registers all at once in the IDE’s panels. | Shows only what you explicitly decide to print. If you need more info, you add another print and run again. |
| Can step line-by-line or even instruction-by-instruction; you can also evaluate expressions or change variable values on the fly. | Not interactive once running; you get a log of values/messages. You can’t change anything mid-run — you only observe what happened after the fact. |
| Requires a compatible environment (e.g. an IDE or debugger tool attached to the process). Not always feasible in production environments. | Works in almost any environment, including production, as long as you have somewhere to output text (console, log file, etc.). |
| Has a learning curve and overhead but provides deep insight and control. Great for complex, hard-to-track issues. | Super easy to use and understand. Great for quick checks and for newcomers. Often the first method learned for debugging. |
As a new developer, your first instinct might be to use prints, and that’s perfectly okay. It’s actually a rite of passage to litter your code with printf("got here!") or console.log("value x is " + x) when you’re trying to figure out what’s going on. Over time, as you get comfortable with an IDE, you’ll want to explore the debugger because it can save you time and give you abilities (like peeking at any variable anytime) that prints can’t. But even the pros use print logs when it makes sense. It’s all about choosing the right tool for the job. The meme exaggerates it as an either/or contest for comedic effect – in reality, you’ll use both techniques in different situations.
The left side of the meme might look intimidating if you’ve never seen a debugger’s interface, especially with those raw memory addresses and assembly instructions. Don’t worry – you don’t need to understand assembly language or CPU registers to use a debugger effectively on your own projects! Those details are there to highlight just how far a debugger can go (all the way down to the metal, so to speak). In normal day-to-day debugging of, say, a Java program or a JavaScript webpage, you’d likely just be looking at your variables, maybe the call stack, and stepping through your own source code, not the disassembly. The magnifying glass in that image is basically saying “this tool lets you inspect super closely.”
On the right side, System.out.println("One printy boi"); is an example of the simplest output statement in Java. If you run that line, it will just print the text One printy boi to the console. In a real scenario, you’d include such a line inside your code where you want to check something. The meme calls it a "printy boi" in a joking way (that’s just playful slang; many memes use the term "boi" for comedic effect). So don’t get confused — it’s not a special function or anything, just a regular print with a silly nickname.
When the meme asks “WHO WOULD WIN?”, it’s implying a battle between these two debugging approaches. The joke is that even though the debugger is far more powerful and sophisticated (it’s like having an entire science lab to investigate a bug), most developers still often choose the quick-and-dirty print approach (which is like using a single tool or clue to solve the mystery). It’s funny because it feels true. People share this meme because they think, “Ha, I also tend to just throw in a print rather than fire up the debugger. Guilty as charged!” It’s a lighthearted reminder that sometimes the simple ways are surprisingly effective.
So, if you’re a beginner: definitely learn how to use your debugger — it’s one of the best friends you’ll have for troubleshooting. But also know that there’s no shame in using prints to understand what your program is doing. Even the experts resort to print logs on occasion, especially when debugging tricky problems or working in environments where the fancy tools aren’t readily available. The key is understanding why prints can be useful versus when a full debugger might be the better choice. This meme just humorously exaggerates the tendency to choose prints, giving a nod to that warm, familiar feeling of seeing that one log line that finally makes things clear.
Level 3: Breakpoints vs Reality
For seasoned developers, this meme hits close to home. It spotlights the absurd-yet-familiar contrast between an advanced debugger packed with features and a single print statement — and playfully suggests that in practice, the print often wins. The image follows the classic who_would_win_format: on the left, a massively overqualified champion (the feature-rich debugger with memory inspectors, register views, breakpoints galore), and on the right, an underdog challenger (just one call to System.out.println("One printy boi")). The humor comes from the implication that despite the debugger’s heavyweight arsenal, the “One printy boi” is the real champ when developers actually get down to fixing bugs. It’s an exaggeration, of course, but it’s rooted in a very relatable truth in programming culture.
Why on earth would a developer choose a humble println over a full-fledged step-through debugging session? The short answer: convenience and habit. The long answer involves developer psychology, environment constraints, and the nature of certain bugs. In theory, the debugger is the superior tool for Debugging and Troubleshooting: it lets you pause the program, inspect any variable’s value, watch the call stack, even change things on the fly. In theory, using the debugger is a best practice taught in school or bootcamps. In reality, when you’re under pressure to find a bug quickly (especially an elusive one), many of us default to the quickest hack that provides insight — and that’s often a print statement.
Developer Experience (DX) plays a big role here. Setting up and using that fancy debugger isn’t always frictionless. You might have to run your program in a special mode, configure debug symbols, or attach an IDE to a remote process. Navigating all those panels (like the Registers and Disassembly views shown in the meme) can be overwhelming if you just want to answer a simple question like “what is the value of variable X right now?” By contrast, print debugging has virtually no setup: add a line of code to output X, run the program normally, and see the answer in the console. It’s instant gratification. Many developers humorously admit that when they’re stuck, they hear a little voice in their head saying, “Just throw in a print and see what’s going on.” It’s the path of least resistance.
There’s also a universal reliability to print_statement_debugging. It works in almost any scenario. If you’re writing a quick Python script or a small C program using a simple text editor, you might not even have an IDE available — but you definitely have print() or printf. Many of us cut our coding teeth using prints to understand code flow. Those habits stick around. Even in large projects, where you do have robust IDEs, sometimes you’re working in an environment where an interactive debugger is cumbersome or impossible. For instance, debugging a cloud service running in a Docker container or on a remote server can be non-trivial; but you can always sprinkle in log statements and deploy, then read the log output. The IDEsAndTextEditors we use might change, but the trusty print statement is a constant companion across them all.
The meme’s DeveloperHumor resonates because it’s a bit of a shared inside joke: as high-tech as our jobs get, we often solve problems with the most low-tech method available. It’s poking fun at ourselves. The caption under the left image goes to great lengths to describe the “fully-engineered debugger” with capabilities to inspect memory, step through instructions, and modify state – basically describing a developer’s dream toolkit. Then on the right side, we’ve got just System.out.println("One printy boi"); in plain black and white text. The phrase "One printy boi" itself is written in a silly, internet-slang way, as if we’re affectionately nicknaming our lone print statement a tiny warrior. This self-deprecating tone – calling a debug print a “printy boi” – indicates we’re in on the joke. We know it’s kind of silly that this one-liner often ends up saving the day. The magnifying-glass icon over the debugger side further drives home the contrast: one side is all about intense scrutiny (like a detective with a magnifying glass going over every detail), and the other side is just a straightforward shout to the console, no fancy tools needed.
From a senior developer’s perspective, the println_vs_debugger showdown is funny because it’s true more often than we’d like to admit. There have been countless times when engineers, after fruitlessly fiddling with breakpoints or analyzing core dumps, finally say “Alright, I’m just going to log some info and rerun this.” And lo and behold, the simple logs expose the issue. It might be something like noticing a value is null or an if-condition never triggers – things you could find in a debugger, but the printout made it obvious with much less mental overhead. It’s not that printing is superior in terms of capability (it’s not); it’s that printing is accessible and quick. It’s the debugging equivalent of grabbing the nearest tool versus setting up the specialized equipment. If the kitchen sink is leaking right now, you grab a bucket (print to log) rather than immediately designing a whole new plumbing schematic (complex debug session). RelatableDevExperience and RelatableHumor arise from exactly these everyday shortcuts.
Another angle to this: time and environment. Not every bug warrants a deep dive. If you suspect a logic error in a small area, adding a couple of print statements to confirm your theory is often faster than stepping through line by line. Additionally, certain bugs (especially timing-related or multi-threaded issues) can be harder to catch in a debugger. As mentioned, pausing the program might make a race condition disappear. Or maybe the bug only happens in the production environment under load, where you can’t attach an interactive debugger without stopping the service. In those cases, well-placed print logs (i.e., writing to log files) are literally the only way to gather clues. This is why even production systems heavily rely on logging. So the joke extends to an underlying truth: even in professional setups with all our fancy monitoring APM tools, a lot of debugging reduces to reading print logs after the fact. In a sense, that single print statement does win the day routinely, by being the most practical option.
It’s worth noting the meme crosses language contexts deliberately: the left shows a C/C++ style debugger (with a .c file and CPU registers), whereas the right uses a Java System.out.println. The message isn’t about one language specifically – it’s about a universal trope in programming. Whether it’s printf in C, System.out.println in Java, console.log in JavaScript, or print() in Python, every language gives you a way to output text. And developers universally reach for that as their debugging comfort food. Meanwhile, debuggers exist in all those ecosystems too (gdb for C/C++, the Eclipse/IntelliJ debuggers for Java, browser dev tools for JS, pdb for Python, etc.), but there’s a running joke that many developers either don’t use them to their full potential or skip them unless absolutely needed. We’ve all heard or experienced stories of someone debugging a gnarly issue by printing variable values to narrow things down. Hence, seeing “WHO WOULD WIN?” framed like a prize fight between the heavyweight debugging tool and the lightweight print line is instantly amusing to anyone who’s been in the trenches of DebuggingFrustration.
One more bit of context: RubberDuckDebugging is another classic debugging method often mentioned alongside print statements (and it even appears in the tags). Rubber duck debugging means explaining your problem out loud, as if to a rubber duck on your desk. It’s funny but effective – by articulating the problem, you often find the solution. In practice, sprinkling print statements throughout your code is like having the code explain itself to you, line by line, after the fact. Both are simple, almost primitive techniques compared to using an interactive debugger, yet both often work when you’re stuck. The meme embraces that contrast: super-sophisticated vs. super-simple. And it cheekily crowns the simple method as the winner by even posing the question. It’s a nod and a wink to every developer reading it: “Fancy debuggers are great, but sometimes you just need to see that one printout. We’ve all been there.”
Level 4: Breakpoint Black Magic
At the deepest technical level, a debugger is performing something close to digital sorcery under the hood. It leverages operating system facilities and CPU hardware features to halt a running program on a dime – establishing a breakpoint that effectively freezes time in the program’s universe. For example, when you set a breakpoint on a specific code line or instruction, the debugger often inserts a special trap instruction at that memory address (or uses a dedicated hardware breakpoint register in the CPU). When the program counter hits that location, bam! – the CPU triggers an interrupt that hands control to the debugger. In an embedded setting (as hinted by the register view and BSP tab in the meme’s left panel), the debugger might even use a JTAG interface or similar on-chip debug module to control the microcontroller’s execution. This allows the developer to inspect memory locations, CPU registers (like the R0, R1, etc. shown in the screenshot), and other low-level state that normally flashes by in nanoseconds. It’s like having a superpower: halting a program in mid-air and peeking at its innards.
The meme’s left half is essentially showing such an embedded debugger UI in action. We see a window titled Start_SineWave.c, with panels for Global Data (variables and their addresses/values), Registers (the CPU’s internal variables), and a Disassembly view (actual machine instructions like LDR R0, [R1] from the ARM architecture). The cartoon magnifying glass hovering over a memory address is a playful touch – a magnifying_glass_visual cue that emphasizes how the debugger lets you zoom in on the tiniest details of execution. With a feature-rich debugger, you can single-step through execution (run the program one instruction at a time), inspecting how each step changes the registers and memory. It’s as if you had X-ray vision for your code: you can see behind the scenes of high-level language into the raw machine operations. You can even modify the program state on the fly. This means while the program is paused at a breakpoint, you could change the value of a variable or register, then resume execution with that new value in place. It’s akin to performing live surgery on your program — altering conditions mid-run to experiment or to force a different code path, all without restarting the whole process. How cool is that?
Under the hood, there’s heavy engineering making this possible. Operating systems provide hooks like the ptrace system call (on Unix/Linux) that debuggers use to control and observe other processes. Modern CPUs often have dedicated debug hardware: for instance, a limited number of hardware breakpoints that can watch for an instruction at a certain address or a watchpoint for accesses to a specific memory address. These don’t slow down execution the way constantly checking in software would. In the meme, those register values (e.g., R0 = 0x200007D6) and memory addresses (0x2000...) suggest an embedded ARM microcontroller where 0x20000000 might be the start of RAM. The debugger is pausing the CPU and reading those registers/memory over a debug interface. The highlighted green line and arrow in the disassembly indicate the current instruction pointer (where the program is stopped). A fully-engineered debugger like this essentially turns your running program into a fully explorable world: time is paused, and you can inspect every nook and cranny of state. Computer scientists have been refining these capabilities for decades — from simple memory dump analyzers to symbolic debuggers in the 1970s, up to today’s graphical IDE debuggers that integrate all these views. It’s a triumph of tooling for Debugging_Troubleshooting in complex software.
Yet, with all this power at our fingertips, there’s an ironic twist: observing or altering a program can itself influence its behavior. This is sometimes humorously referred to via the Heisenberg Uncertainty Principle analogy. In computing, a Heisenbug is a bug that seems to disappear or change when you try to study it (for example, when running in a debugger or with extra logging). By pausing a program, you might avoid a race condition or timing-sensitive fault that only appears at full speed. A real-time system might behave perfectly when stepped through slowly, but freak out when running normally! This is where even advanced debuggers meet their match – some issues only manifest in a live, un-interrupted run. Interestingly, print statement debugging is often less intrusive in that sense: a simple printf doesn’t entirely halt the program; it lets the code run in real time, just adding minimal output. That means if something weird happens only under normal conditions, print logs might capture it whereas a break-in debugger would inadvertently hide it. In other words, despite all the black magic a debugger can do, there are scenarios where the humble print statement is actually more effective at illuminating a problem. And that sets the stage for this meme’s tongue-in-cheek battle: all the king’s debugging horses and all the king’s men, versus one little print statement. Who will win? The answer, surprisingly often, is the latter.
Description
A 'Who Would Win?' meme format comparing two methods of debugging code. On the left, under the text 'An advanced, fully-engineered debugger...', there is a screenshot of a complex debugging interface, likely from an IDE for a low-level language like C or C++. It shows panels for memory locations, registers, and disassembly, with a magnifying glass hovering over the code. This represents the powerful, 'correct' way to debug. On the right, against a plain white background, is a single line of Java code: 'System.out.println("One printy boi");'. This represents the simple, often-used-in-practice method of inserting print statements to check variable states. The humor stems from the universal developer truth that despite the availability of sophisticated tools, the quick and dirty print statement is often the go-to solution, making it the unexpected winner in many real-world scenarios
Comments
7Comment deleted
A debugger is for when you don't know what the problem is. A print statement is for when you know exactly what the problem is, but you'd just like the computer to admit it
Twenty years of cycle-accurate tracing, hardware breakpoints, and time-travel debugging - yet the race condition only confesses to the lone println jammed between two synchronized blocks
After 20 years in the industry, I've mastered every debugger from GDB to Chrome DevTools, yet somehow my most reliable debugging partner remains console.log() - because nothing says 'senior architect' quite like adding print statements to a distributed system running at scale
After 20 years in the industry, I've learned that the most sophisticated debugging tool is no match for a strategically placed print statement at 3 AM when production is down. Sure, your IDE can inspect memory addresses, step through assembly, and modify register values in real-time - but can it give you that instant dopamine hit of seeing 'GOT HERE 3' in the logs? The debugger is like that expensive espresso machine you bought: impressive, powerful, and gathering dust while you reach for instant coffee. One printy boi wins every time because sometimes the best engineering solution is the one that actually ships before the sun comes up
Breakpoints and watchpoints are powerful, but one System.out.println adds just enough I/O and timing perturbation to collapse the Heisenbug’s wavefunction into a reproducible prod incident
Native debuggers let you surgically rewrite runtime reality; Java's println ritual demands rebuilds for every hypothesis - because true enterprise debugging scales with log volume
The debugger can single-step a function; System.out.println can cross service boundaries, survive Kubernetes reschedules, and be grepped at 3 a.m - guess who wins