Skip to content
DevMeme
1484 of 7435
The Debugging Staredown: Me vs. The Stack Trace
Debugging Troubleshooting Post #1661, on Jun 4, 2020 in TG

The Debugging Staredown: Me vs. The Stack Trace

Why is this Debugging Troubleshooting meme funny?

Level 1: Hidden in Plain Sight

Imagine you’re really upset because you can’t solve a puzzle. You’re almost in tears, yelling that the last puzzle piece is missing. Meanwhile, that missing piece is sitting right there on the table, in plain view. All you had to do was look down and see it. This meme is like that: the person (a developer) is angrily complaining about a problem, but the answer is quietly right in front of them the whole time. It’s funny and a bit silly – just like yelling “I can’t find my toy!” while the toy is actually in your hand. The lesson? Sometimes when we’re frustrated, we overlook the obvious solution that’s been there all along.

Level 2: Console Clues

Let’s break this down in simpler terms. In software development, a bug is a coding mistake or problem that makes the program behave incorrectly. Debugging is the process of finding and fixing those bugs. Now, when a program crashes or hits an error, it often prints out an error message along with a stack trace. A stack trace is basically a list of the active functions (or methods) that were running when the error happened, typically printed from the deepest call up through the main function. It’s like the program saying, “Here’s the path I took, and I tripped right here!” The stack trace usually includes the error type and a message about what went wrong. For example, if your code tries to access the 10th element of a list that has only 5 elements, you might get an error message like “IndexError: list index out of range” (in Python) or similar in other languages. The stack trace would show you which lines of which files led to that error. Here’s a tiny example of what a Python stack trace might look like when a bug occurs:

Traceback (most recent call last):
  File "app.py", line 15, in <module>
    main()
  File "app.py", line 10, in main
    buggy_function()
  File "app.py", line 5, in buggy_function
    result = some_list[5]  # trying to access index 5 in a list that’s too short
IndexError: list index out of range

In the above snippet, the program is telling us:

  • In app.py at line 5, inside the function buggy_function(), it tried to do something bad (some_list[5] when some_list isn’t that long).
  • This buggy_function() was called by main() at line 10.
  • And main() was called in the top-level of the program at line 15.
  • The final line IndexError: list index out of range is the actual error message explaining the problem (you went out of bounds of the list).

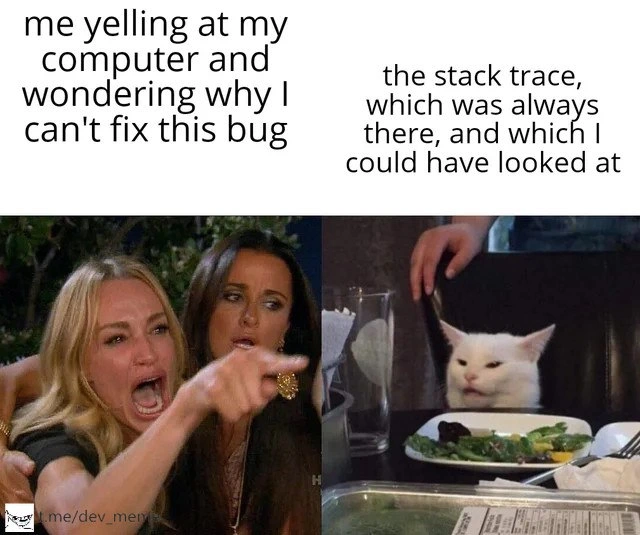
So how does this relate to the meme? The meme shows a classic situation: the developer is frustrated and angry, “yelling at my computer wondering why I can’t fix this bug”, while the answer is literally right there in the stack_trace output. The right side text, “the stack trace, which was always there, and which I could have looked at,” points out that the error information was available the whole time. In debugging, overlooking_logs and console output is a common rookie mistake. Maybe the programmer didn’t scroll up in their terminal to see the error, or they dismissed the long stack trace as gibberish. The cat in the meme represents the stack trace – it’s calm, just sitting there with a blank stare, like the lines of error text sitting patiently in your console. The woman yelling represents the developer’s developer_rage and frustration at the bug. The joke is that the developer is essentially ignoring the very thing that would help solve the problem. It’s akin to covering your ears while the computer is trying to tell you what went wrong. Every experienced coder learns that when something breaks, the first thing to do is check any ErrorMessages or logs produced. Those messages often pinpoint the file, function, and even the line number where the bug occurred. That’s a huge hint! In other words, the console output (which includes the stack trace) is full of clues. But in the heat of the moment, a panicked programmer might skip reading it and instead try random fixes or Google searches, all the while the answer was right there. The meme’s text even says “which was always there” to emphasize that from the beginning of the debugging session, the stack trace was available as a guide. The humor (and slight embarrassment) comes from realizing you wasted time shouting at the computer when you could have just calmly read the output it gave you. It’s a gentle poke at all of us who have been in “WTH is wrong with my code?!” mode and forgotten to do the obvious: read the stack trace.

Also, notice the watermark "r/me/dev_meme" on the image – that indicates it’s from an online developer meme community. This format (the woman_yelling_at_cat_meme) is popular for highlighting two sides of a situation. Here the two sides are: 1) the emotional, confused developer vs. 2) the factual, already-there information (the stack trace). For a junior developer or someone new to coding, the lesson underneath the joke is: always check the error logs and stack traces. They might look intimidating at first, but they exist to help you pinpoint issues during BugFixing. Over time, reading those logs becomes second nature and saves a ton of grief. In short, this meme humorously captures a SoftwareBugs fix scenario where the biggest obstacle wasn’t the complexity of the bug, but the developer’s own failure to utilize the available information. It’s both funny and a little educational: reminding you not to ignore the obvious clues when troubleshooting.

Level 3: Stacktrace Standoff

This meme hits on a painfully familiar Debugging_Troubleshooting scenario that every seasoned developer recognizes. On the left, we have "me yelling at my computer and wondering why I can't fix this bug" – that’s the frustrated developer, red in the face, caught in classic DebuggingFrustration. On the right, we have "the stack trace, which was always there, and which I could have looked at" – the error output (embodied by the blank-faced cat) just sitting there, utterly unbothered, containing the answer all along. The humor comes from the contrast: the developer is livid, overlooking logs and console output, while the stack trace (the sequence of function calls leading to the error) is quietly providing the clues. It’s a DeveloperExperience_DX lesson wrapped in a joke: the tools to solve the bug were right in front of us, but in our developer_rage we ignored them.

In real life, a stack trace is essentially the program’s way of saying “Here’s exactly where and how things blew up.” It lists the nested calls (the call stack) that led to an exception or error, often including file names and line numbers. The meme’s punchline is that the stack trace “was always there” – meaning from the moment the error occurred, the program probably dumped a bunch of text (the stack trace) into the console or log file. But the beleaguered developer (like the yelling woman) didn’t bother to read_the_stacktrace. Maybe they were too panicked, too angry, or simply unaware that those cryptic lines hold the key. Every senior engineer has watched a junior dev tear their hair out over a stubborn issue while the answer was literally printed out in the terminal. (Heck, many of us senior engineers have done this at 3 AM during an on-call firefight – angrily rebooting servers or rewriting code, only to finally scroll up and see the ErrorMessages spelling out the problem.) The meme uses the famous woman yelling at cat format to dramatize this disconnect: the developer’s emotional meltdown versus the cat’s (stack trace’s) indifferent stare. The cat’s calm, almost blank expression is meme-perfect for an error log that “doesn’t care” if you’re upset – it’s just calmly listing facts about the crash.

From a high-level perspective, this image is poking fun at our human tendency to do BugFixing the hard way. We often get so caught up in the symptom (“Why isn’t this working?!?”) that we ignore the diagnosis the system is providing. It’s like yelling at a car for breaking down while the check-engine light has been on the whole time. The SoftwareBugs we encounter can be infuriating – and the longer a bug eludes us, the more prone we are to rage-blindness. The meme’s text “which was always there, and which I could have looked at” captures that sheepish realization after the fact: the developer finally notices the stack trace they had all along and probably feels as silly as someone screaming at an answer key they forgot to read. It highlights a core debugging truth: ErrorMessages and stack traces are there to help, but they only help if you pay attention to them. The image is a light-hearted reminder (with a sarcastic bite) that one of the first rules of debugging is “check the logs before you lose your cool.” In practice, experienced devs know to treat a stack trace like a treasure map – follow it to find where things went wrong. The yelling-instead-of-reading behavior is an industry in-joke, an anti-pattern we’ve all been guilty of. After all, in software engineering DebuggingPain is real – but sometimes we’re the ones making it harder by ignoring the obvious clues. The meme is funny because it’s true: more often than we’d like to admit, BugsInSoftware feel impossible until we finally notice that humble stack trace quietly pointing to the solution.

Description

This meme uses the popular 'Woman Yelling at a Cat' format to illustrate a common developer frustration. The left panel features a distraught Taylor Armstrong from 'The Real Housewives of Beverly Hills', pointing and yelling. The text above her reads: 'me yelling at my computer and wondering why I can't fix this bug'. The right panel shows Smudge the Cat, looking confused and unimpressed behind a plate of salad, with the text above it saying: 'the stack trace, which was always there, and which I could have looked at'. The joke lies in the developer's misplaced anger and frustration, blaming the machine for a problem while ignoring the very tool - the stack trace - that provides the answer. It's a universally relatable experience for programmers who, in a moment of panic or stubbornness, overlook the most obvious clues and waste hours on a problem that the error log already solved
Comments

7
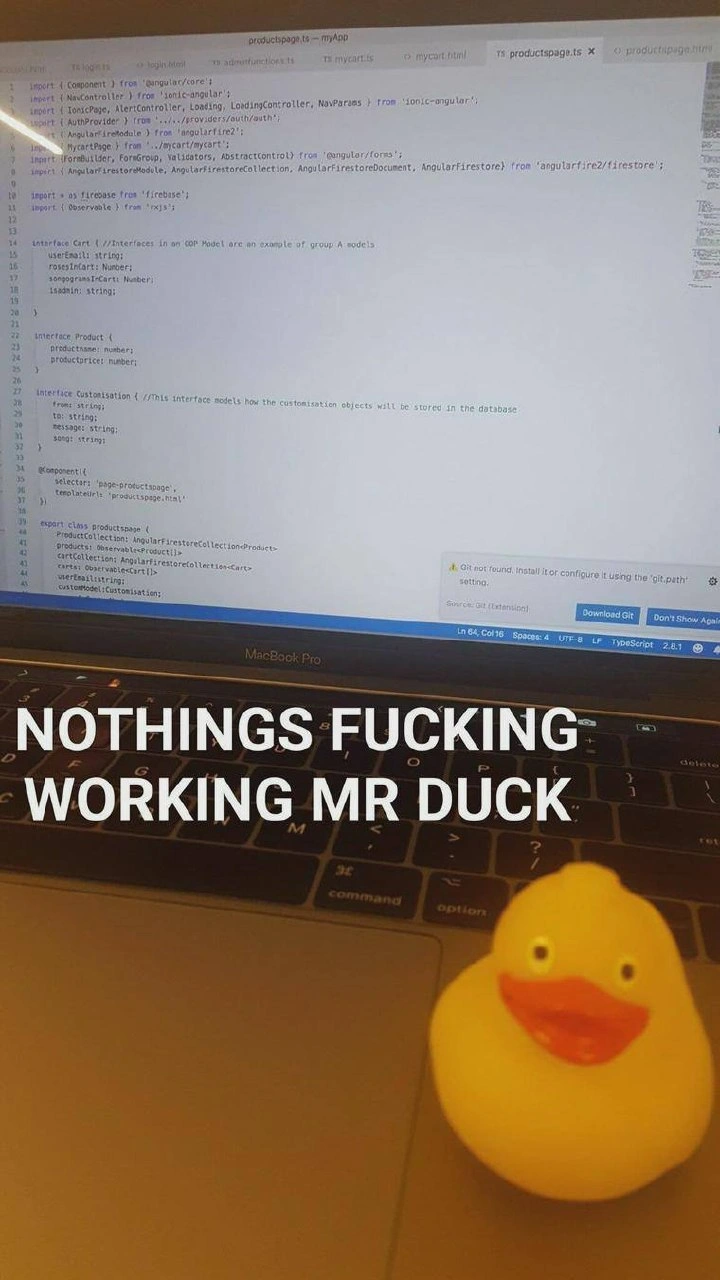
Anonymous ★ Top Pick The fastest way to solve a bug is to explain it to a rubber duck. The second fastest is to finally read the stack trace you've been ignoring for the past hour
  1. Anonymous ★ Top Pick

    The fastest way to solve a bug is to explain it to a rubber duck. The second fastest is to finally read the stack trace you've been ignoring for the past hour

  2. Anonymous

    I built a petabyte-scale observability pipeline - distributed tracing, anomaly detection, the works - mostly so I can ignore the same first line of the stack trace in six regions simultaneously

  3. Anonymous

    After 20 years in this industry, I've learned that the stack trace is like documentation - we all know it's there, we all know it would help, but we'd rather spend three hours implementing our own creative solutions than two minutes reading what's right in front of us

  4. Anonymous

    The stack trace sits there like a patient senior engineer, calmly holding all the answers - line numbers, function calls, the exact moment everything went sideways - while you're three hours deep into adding random print statements and questioning your career choices. It's the technical equivalent of searching for your glasses while wearing them, except the glasses are literally screaming 'NullPointerException at line 247' and you're still convinced the problem must be something more exotic

  5. Anonymous

    15+ YoE wisdom: The bug's root cause is always the first line of the stack trace, scrolled past in denial

  6. Anonymous

    Senior debugging workflow: model Kafka backpressure and GC pauses, then finally read the stack trace that’s been politely saying “NullPointerException at ConfigLoader.java:42” the whole time

  7. Anonymous

    Every time I fire up the debugger before reading the stack trace, an SRE loses 0.1% of the error budget

Use J and K for navigation