Skip to content
DevMeme
5067 of 7435
The Duality of Debugging: Sophisticated Tools vs. Bathroom Epiphanies
Debugging Troubleshooting Post #5546, on Sep 29, 2023 in TG

The Duality of Debugging: Sophisticated Tools vs. Bathroom Epiphanies

Why is this Debugging Troubleshooting meme funny?

Level 1: Tools vs Tears

Imagine you and a friend are trying to solve a really hard jigsaw puzzle. Your friend is doing it the smart way: they have the picture on the puzzle box for reference, and they’re calmly picking up one piece at a time, checking where it fits. They even have those special puzzle sorting trays (like a little tool) to organize pieces by color and shape. They’re focused and patient. Before long, you see the puzzle starting to come together – corner pieces in place, edges lined up, the picture forming. Your friend is like the person in the top part of the meme, using the right tools and a step-by-step method to solve the problem.

Now there’s you (this is me in the meme 😅). You look at the pile of puzzle pieces and it just makes your head hurt. You’re not using the box picture or any method – you’re just randomly grabbing pieces, trying to force them together. Nothing fits. Pieces seem missing or wrong (even though they’re all there). The more you try, the more upset you get. It’s like the puzzle is outsmarting you. You feel yourself getting frustrated, maybe even teary-eyed. You know that feeling when you’re so upset you might cry or your tummy hurts? You’re basically on the verge of that. In the meme’s language, you’ve gone from “debugging the puzzle” to wanting to just give up and hold your head in your hands by the nearest trash can (or toilet, like the picture). Your friend might look over and say, “Hey, maybe try sorting the pieces first?” But by that point you’re too frustrated to even think straight.

So on one side, we have someone using tools and a plan to calmly fix a problem (or solve a puzzle). On the other side, we have someone so overwhelmed that they’re almost in tears. The meme is saying that sometimes, when I’m trying to fix a coding problem (debugging), I feel like that second person. Instead of calmly using the fancy debugger tool to step through the code (like a logical puzzle-solver), I’m figuratively pulling my hair out and feeling sick, the way you might if you got completely frustrated with a hard puzzle or homework problem and ended up crying.

It’s a funny way to admit, “I get really upset when I can’t find a bug in my code, while it seems like other people stay calm and figure it out.” But don’t worry – even the calm friend solving the puzzle has probably felt the same frustration at times. The joke just makes it easier to handle: we laugh at the comparison because we’ve all been there, feeling stressed and icky over a tough problem. In real life, of course, if you get that frustrated, it’s a good idea to take a break, maybe ask for help, and come back with a clear head – just like stepping away from a puzzle when it stops being fun. But the meme’s over-the-top toilet scene makes us chuckle and say, “Yep, I felt exactly like that yesterday trying to fix my code!”

Level 2: Debugger vs Despair

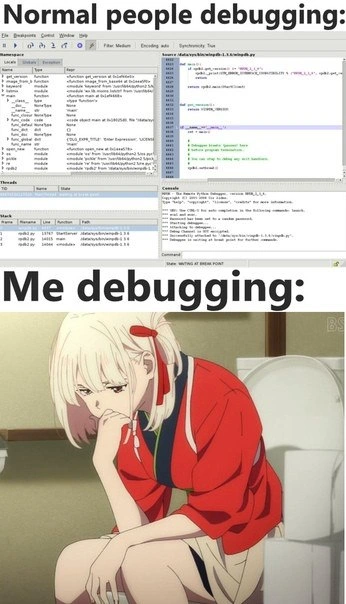
Let’s break down what’s happening in this meme in simpler terms. Debugging is the act of finding and fixing errors (bugs) in your code. In the “Normal people debugging” image (top panel), we see what looks like a typical IDE (Integrated Development Environment) with a debugger running. An IDE like this (for example, Visual Studio, IntelliJ, or PyCharm) provides a graphical way to troubleshoot programs. There are panels and windows showing things like the call stack (the list of function calls that brought the program to its current point), the threads (if the program is doing multiple things at once), and the variables in the current scope along with their values. There’s also a section likely showing the source code with a highlighted line – that’s where the program is paused at a breakpoint. A breakpoint is a marker you set on a line of code to tell the program “pause here when you get to this line, so I can take a look around.” When the program is paused, you can do a step-by-step execution (step into functions, step over them, etc.) to observe how things change. The console output area at the bottom is showing any text the program has printed so far, or possibly messages about program execution.

All of that looks pretty orderly and professional – it’s how we’re taught to debug in school or by the book. The meme calls this "Normal people debugging" as if a competent, well-trained developer debugs in this clean, controlled manner. They use the proper tools, they inspect variables by simply hovering or looking at the watch window, and they methodically narrow down the issue. It’s like watching a mechanic calmly use diagnostic instruments to find out why a car engine is stalling. The debugger is doing a lot of heavy lifting: you don’t have to mentally guess what’s in each variable or why the program crashed – you can see it live. For example, if a program crashes because pointerVariable was NULL (zero) when it shouldn’t be, a debugger can show you exactly where that happened and what the call stack was, so you know which sequence of calls led to the problem. This is essentially Debugging_Troubleshooting 101: use the right tools to examine the program’s behavior.

Now, compare that to “Me debugging” (bottom panel). Instead of a fancy tool, we see an anime character who looks distressed and exhausted, literally sitting next to a toilet as if they’re sick. This is a humorous way to say: When I debug, I feel awful, like I might puke. In plainer terms, it suggests that my debugging process is a mess. Maybe I’m not using the debugger at all! A lot of new developers (and, to be honest, plenty of experienced ones too) often resort to print statements or logging to debug. This is sometimes called "printf debugging" (or console.log debugging in JavaScript, etc.), where you put lines in your code like printf("value of x is %d\n", x); or console.log(x) to print out the value of variables at certain points. Then you run the program and watch the output flood by, hoping to catch where things go wrong. It’s a bit like trying to find a specific scene in a movie by developing the film frame by frame and pinning them to a wall – it works, but it’s labor-intensive and clunky. Without a structured debugger, you might re-run the program dozens of times, printing different things, or adding and removing lines to narrow down the issue. That can be really frustrating and slow.

For example, instead of using a breakpoint to watch a loop’s behavior, someone might do this:

// "Print debugging" example in C++:
for (int i = 0; i < n; ++i) {
    std::cout << "Index " << i << " has value " << arr[i] << std::endl;
    // ... some code using arr[i] ...
}

Here we’re printing every index and value of an array to see where something might go wrong. This can produce a huge amount of output if n is large, and you’ll have to manually read through it to spot any anomalies. It’s easy to miss the important line in all that noise. In a debugger, by contrast, you could simply pause when i reaches a certain value or when arr[i] meets a condition, and inspect the state right then and there, without printing everything.

The meme exaggerates that when I debug, I end up like a person kneeling by a toilet. That’s a comically extreme image for feeling overwhelmed, sick, or defeated. Why might a developer feel that way? Because debugging often isn’t straightforward. Especially early in your career (or whenever you encounter new, gnarly problems), you might not even know where to look. Imagine your code is throwing a null pointer exception or segmentation fault (meaning it tried to access memory that isn’t valid). A beginner might not know how to use the debugger to inspect memory or the call stack. Instead, they might try random tweaks: add some prints, run again, still crash. Google the error message, try a suggestion, still crash. Each failed attempt increases panic: “Why can’t I find this? What am I missing?!” After hours of this, it’s easy to feel exhausted and frustrated. In a humorous sense, you might feel like you’re “sick of it” – hence the toilet scene. (Also, let’s be honest, some debug sessions are fueled by lots of coffee or energy drinks and junk food, which can make your stomach upset too – debugging fatigue and too much caffeine is a nasty combo!)

The reference to an anime character adds a fun twist. Developers often use anime or pop culture images in memes to dramatize feelings. You don’t necessarily need to know which anime this is from; it’s just clearly a depiction of someone looking miserable. It captures the emotion: head in hand, face pale, like they’ve been through an ordeal – which is exactly how a long debugging session can feel. We sometimes jokingly call tough debugging sessions “Debugging Hell”. The tags like DebuggingFrustration, DebuggingFatigue, and DeveloperFrustration all point to this shared sentiment: debugging can be really tiring and frustrating, to the point where you feel burnt out.

To put it simply, the meme is comparing:

  • Organized debugging (using proper tools, staying calm, like "normal people") – represented by the neat IDE screenshot.
  • Chaotic or painful debugging (feeling lost, possibly using ad-hoc methods, getting upset) – represented by the person who looks like they’re about to either cry or puke from distress.

If you’re a junior developer, you might relate to the bottom image if you’ve ever been stuck on a bug for hours. Maybe you’ve had that experience of your code not working and you just put your head on the desk (or theoretically, on the toilet 😅) because you’re so frustrated. The meme uses humor to say: “It’s okay, many of us feel this way.” It’s normal in the developer community to sometimes joke that debugging is painful. In fact, debugging is often considered more difficult than writing the code in the first place. There’s a famous saying: “Writing code is understanding a problem enough to make the computer do it, but debugging code is understanding it completely to see why the computer isn’t doing what you expected.” That can be a tall order!

However, there’s also a hint of advice hidden here: using a good debugger (like in the top panel) can make debugging less painful. Many newcomers don’t take full advantage of debugging tools initially – perhaps they don’t know how, or they feel more comfortable adding print statements because it’s straightforward. But learning to use breakpoints and watches can save a lot of headache (and stomach ache). It’s a bit like learning to use the proper toolbox instead of brute-forcing something. The meme exaggerates the difference (most of us fall somewhere in between these two extremes), but the point lands because we’ve all felt like the person in the second panel at some point.

In summary, “Debugger vs Despair” is the theme:

  • The Debugger (and a systematic approach) is how one imagines debugging should go.
  • The Despair is how it sometimes feels it’s going, especially when you’re stuck or not using the tools effectively.

The meme is funny to developers because it takes a very real feeling – “ugh, debugging this issue is making me want to die” (an exaggeration, of course) – and visualizes it in a ridiculous yet relatable way. And importantly, it assures you that you’re not alone; even if you feel like the only one struggling while “normal” devs have it together, trust me, everyone has been that exhausted bug-hunter at some point. It’s a rite of passage in the world of coding, and we laugh so we don’t cry!

Level 3: Breakpoints & Breakdowns

This meme draws a sharp contrast between methodical debugging and the emotional breakdown that debugging can induce. In the top panel (“Normal people debugging”), we see a full-fledged debugger GUI: a serene, organized arsenal of menus, call stack listings, variable watch windows, and a live code view. This represents the ideal debugging scenario – a developer coolly stepping through code, inspecting variables at breakpoints, like a CSI investigator methodically examining clues. The interface looks reminiscent of Visual Studio or similar IDEs, with threads listed, memory addresses, and console output neatly displayed. It’s the portrait of a professional debugging workflow: set a breakpoint at a suspect line, run the program, it pauses right where you want, and you calmly poke around the state (x is 5 when it should be 7… aha!) until you pinpoint the flaw. In theory, Debugging_Troubleshooting is supposed to look like this: rational, systematic, almost clinical.

Enter the bottom panel (“Me debugging:”): an anime character in a red kimono crouched by a toilet, looking absolutely defeated and nauseous. This dramatic image is played for laughs, but it’s painfully relatable. It’s capturing that visceral DebuggingFrustration and fatigue that hits when a bug refuses to be found. The implication is: other developers might be using fancy tools and calmly traversing their code… meanwhile I’m reduced to a wreck, feeling like I’m about to throw up from stress. The juxtaposition is comedic because the difference is so extreme – it’s the classic normal_vs_me_meme_format. We’re poking fun at ourselves: “normal people” (maybe senior devs or that one unflappable colleague) attach the debugger, inspect memory, and fix the bug in 5 minutes, while me, I’ve been staring at the screen for 5 hours, head in hands, on the verge of a breakdown (or a literal breakdown over the porcelain throne). It’s an exaggeration of imposter syndrome (“Everyone can do this except me!”) that many devs secretly feel during a tough bug hunt.

Why does debugging inspire such drama? Because finding the root cause of a bug is hard. The meme hints at DeveloperExperience_DX lessons: Real-world debugging can be a marathon of trial and error that drains you mentally and physically. For example, imagine chasing a crash in a large C++ codebase. You run the debugger, but the program crashes without a helpful stack trace. Or it only crashes in the production environment, not on your machine – a classic scenario that can drive anyone up the wall. After hours of watching the program flow and nothing making sense, you start feeling that mix of anxiety, frustration, and exhaustion. It’s almost like a form of motion sickness from riding the wild roller coaster of code execution. The anime image of feeling sick in the bathroom hilariously captures that extreme fatigue and DebuggingHell state of mind. (Plus, using an AnimeReference adds an extra layer of dramatic flair – anime characters are masters of looking utterly defeated in a visually expressive way.)

There’s also an implicit commentary on IDEs_Editors and tools here. The top panel suggests “proper” debugging uses the integrated tools – breakpoints, watches, maybe even memory analyzers. The bottom panel suggests that in practice, many of us end up doing something far less elegant – perhaps resorting to printf statements, Google searches, Stack Overflow pleas, and lots of head banging. The contrast could be interpreted as “people who know what they’re doing vs. me”. But even seasoned developers sometimes end up in “toilet mode” during a particularly nasty bug. Ever had a heisenbug that only appears when the moon is full? Or a multi-threading issue where pausing the debugger makes the problem vanish (so you have to debug with logs and guesses)? Those can reduce the best of us to a facepalm and a stomach-churning dread.

Consider common scenarios that lead to this comedic despair:

  • The Code That Defies Logic: You’re staring at a function that “should” work, the debugger shows all the variables are correct… yet the program crashes. You step line by line 100 times. Nothing. At that point, your brain feels like mush, and you sympathize with that anime character’s thousand-yard stare.
  • Environment-Specific Bugs: It works on your machine, but not on QA or production. Normal debugging isn’t straightforward because you can’t replicate the exact environment easily. You try remote debugging or sprinkle log statements everywhere. Hours later, you’re slumped in your chair, contemplating the meaning of life (and whether you chose the right career).
  • Long Debug Sessions: Sometimes debugging is not quick; you might spend an entire day (or night) stepping through code. The mental fatigue accumulates. Your posture degrades from upright at morning to head-in-hands by midnight. The meme’s toilet visual is an exaggeration of that end-of-day collapse – when you’ve had too much debugging, analogous to having too much to drink (and ending up at the toilet). Debugging hangovers are real – your brain feels fried, your eyes hurt from staring at hex dumps or call stacks, and you might genuinely feel a bit queasy from stress and caffeine abuse.

The humor also stems from the notion that debugging is supposed to be a proud display of problem-solving skill, yet here it’s depicted as a humiliating defeat. It’s poking fun at the difference between expectation and reality. Expectation: I’ll fire up the debugger, use my big-brain developer tools, and squash this bug in no time. Reality: The bug is laughing at me as I try one thing after another with no success, until I’m metaphorically (hopefully not literally) on the floor next to a toilet. The DebuggingFrustration tag really says it all – frustration so intense you might feel sick.

One could even say this meme highlights a common developer coping mechanism: humor. By joking that debugging makes us want to puke, we’re bonding over how painful the process can be, yet we soldier on. Every developer knows the triumphant feeling of finally fixing that bug from hell – but before that victory, it might put you through a bug hunt that tests your sanity. This meme captures that low point in the hunt. It’s an empathy laugh: “Hey, I’ve been that person on the floor too.”

In summary, the top image’s professional debugger interface represents the textbook approach to troubleshooting, whereas the bottom image shows the human reality behind the scenes. No matter how fancy our tools, the experience of debugging a stubborn issue often devolves into exhaustion, desperation, and dark humor – perfectly encapsulated by Breakpoints & Breakdowns. Even if we don’t literally crouch by a toilet, mentally we might feel just like that anime character during a brutal bug battle. And when someone shares a meme like this on a Friday (#memeFriday indeed), developers light-heartedly nod in agreement (maybe while nervously laughing at how accurate it feels).

Level 4: Heisenbug Hangover

At the most profound level, debugging isn’t just a battle against a pesky bug – it’s a struggle against the fundamental complexity of computing. When you run a debugger (like the Visual Studio-style interface in the top panel), you are essentially observing and manipulating a running program’s state. But observation itself can alter behavior, invoking the observer effect familiar from physics. This gives rise to the infamous Heisenbug: a bug that disappears or changes when you try to examine it. For example, adding a printf or setting a breakpoint might change the timing in a concurrent program, causing that elusive race condition to vanish when observed. It’s as if the act of debugging a Schrödinger’s bug forces it into hiding – leaving the developer doubting their sanity. No wonder the meme’s "me debugging" character looks physically ill: chasing a Heisenbug is like trying to capture a subatomic particle; by the time you think you’ve got it, it’s somewhere else. 🐛⚡

Deep down, this humor touches on theoretical limits of problem-solving in software. Determining exactly why a complex program misbehaves can border on solving the Halting Problem – fundamentally undecidable in the general case. We can’t write a magic program to find all other program’s bugs (Alan Turing proved that decades ago), so we’re stuck with step-by-step debuggers and our own wits. The human brain and its tools must explore a vast state space of program execution. Even a small program can have an astronomical number of possible states and paths. Locating the one path that triggered a bug is like finding a needle in an exponentially large haystack. That mental load can induce a hangover of exhaustion – much like the hunched anime character by the toilet, suffering from a state-space overdose.

Under the hood, professional debuggers interact with your program at a low level: inserting breakpoints often means patching the program’s binary code in memory with a trap instruction (like an INT 3 on x86) so the OS pauses execution at that point. The debugger can then inspect CPU registers, memory addresses, and call stacks. This is powerful, but it’s not omniscient magic – it’s constrained by the same complexity as the code. If the bug involves undefined behavior (like reading uninitialized memory in C/C++), even the debugger might show you misleading information (since the program state itself is nonsensical). If the bug is timing-dependent (like a race condition in multithreaded code), stopping the program to inspect it may prevent the bug from happening, because you’ve changed the timing. It’s a twisted irony: the very act of debugging can make some bugs hide, much to the developer’s despair.

And let’s not forget, formal verification and advanced static analysis exist to minimize such pain by proving correctness mathematically – but those are notoriously difficult to apply to large, real-world codebases. So day-to-day, even senior engineers often face bugs that reduce them to the state of that sickly anime protagonist. The meme’s dark exaggeration carries a kernel of truth: debugging a complex issue can feel like an interminable all-nighter that leaves you as wrecked as a bad hangover. In the end, the Heisenbug Hangover is both a humorous exaggeration and a nod to the reality that some bugs can make even the most seasoned developers feel utterly defeated.

Description

A two-panel meme contrasting different approaches to debugging. The top panel is labeled 'Normal people debugging:' and displays a complex graphical user interface of a Python IDE's debugger. It shows multiple panes, including the source code with a breakpoint set, a variable inspector, the call stack, and a console window, representing a structured and tool-driven process. The bottom panel, labeled 'Me debugging:', features an image of a blonde anime character, Chisato Nishikigi from the series Lycoris Recoil, sitting on a toilet with a pensive and distressed expression. This meme humorously juxtaposes the idealized, methodical image of debugging with the often messy, frustrating, and intensely mental reality. It suggests that solving the most difficult bugs requires stepping away from the code and engaging in deep, sometimes desperate, contemplation, which can happen in the most mundane of places
Comments

16
Anonymous ★ Top Pick A breakpoint pauses the program, but a bathroom break pauses the programmer. Only one of these reliably leads to a solution
  1. Anonymous ★ Top Pick

    A breakpoint pauses the program, but a bathroom break pauses the programmer. Only one of these reliably leads to a solution

  2. Anonymous

    My IDE boasts time-travel debugging, but three microservice hops and one Heisenbug later I’m still hunched over /var/log like it’s a toilet, praying grep explains what just came back up

  3. Anonymous

    After 20 years in tech, I've learned that the most critical debugging tool isn't your IDE's step-through debugger or your meticulously placed breakpoints - it's the porcelain throne where you finally realize you've been debugging in production instead of staging for the past three hours

  4. Anonymous

    The most powerful debugging tool isn't the IDE's step-through debugger, watch windows, or call stack inspector - it's the ability to sit in existential contemplation, mentally executing your code path by path, until you realize the bug was a typo in a variable name you've been staring at for three hours. Sometimes the best breakpoint is the one between your ears, though it rarely comes with a 'continue execution' button for your sanity

  5. Anonymous

    Normal debugging uses breakpoints; mine uses breakdown points - staring at a bathroom wall modeling the Heisenbug that vanishes the instant you attach a debugger

  6. Anonymous

    Breakpoints? Nah, porcelain points: where race conditions serialize and the real stack overflow happens

  7. Anonymous

    Breakpoints are great until you meet a timing bug; then the only debugger that doesn’t perturb the system is the bathroom, where you single‑step the happens‑before graph in your head and realize the logger holds the lock

  8. @Broken_Cloud_1 2y

    Why do normal people use light theme!?

    1. Alexander Berdnikow 2y

      Light theme is better, because other colors have better contrast with white than with black.

      1. @theu_u 2y

        Also in vscode most of dark themes literally sucks

      2. @Broken_Cloud_1 2y

        no gosh it destroys my eyes

  9. @M_Ali_S_S 2y

    fr😂

  10. @Vlasoov 2y

    Ah, yes, Chisato, exactly

  11. @SamsonovAnton 2y

    Thou shalt not write shitty code.

  12. Deleted Account 2y

    I have no much idea how to use a debugger

  13. @parijatsoftwares 1y

    the classic

Use J and K for navigation