The Unsung Hero: When a Real Debugger Tries to Join the Print Statement Party
Why is this Debugging Troubleshooting meme funny?
Level 1: The Friend Who Doesn't Fit In
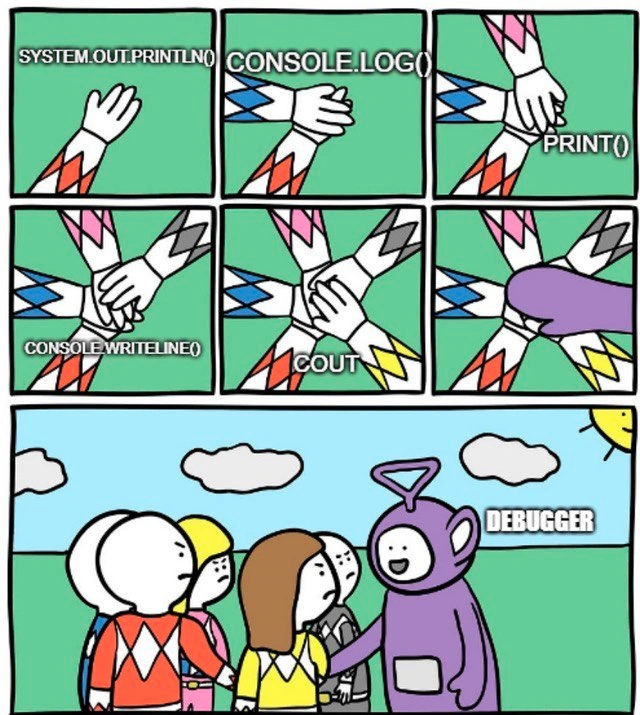
Imagine a group of best friends doing a team handshake before the big game — every hand goes in, one by one, perfect teamwork. Then a giant purple plush toy from a completely different TV show wanders over, puts his hand in too, and grins, while the whole team turns and stares like, who invited this guy? That's the joke: all the simple, familiar tools are old friends, and the fancy professional tool — the one that's technically the strongest player — is the lovable weirdo nobody ever picks for the team.
Level 2: Two Ways to Catch a Bug
When your program misbehaves, you have two basic tools:
- Print debugging: Sprinkle output statements —
console.log("got here", user)— through your code, run it, and read the story it prints. Each language in the comic has its own incantation, but they're all the same idea: make the invisible visible by writing it to the screen. - A debugger: A dedicated tool (built into IDEs like VS Code or IntelliJ) that pauses your program at a breakpoint — a line you mark — and lets you inspect every variable, step through line by line, and watch the program live. Strictly more powerful, and yet the awkward purple guy in the bottom panel.
Early-career reality check: your first instinct will be prints, your mentor will tell you to "learn the debugger," and both are right. The debugger is genuinely worth learning — stepping through someone else's code is one of the fastest ways to understand a codebase. But you'll also discover why prints persist: they work when the debugger can't reach (remote servers, weird build setups), and removing the seventeen print("WTF") lines before committing is a rite of passage. (Leaving one in production and seeing it in the logs a year later is the advanced version.)
Level 3: The Observability Tool Nobody Invited
Look at the roster stacking hands in that huddle: SYSTEM.OUT.PRINTLN() for Java, CONSOLE.LOG() for JavaScript, PRINT() for Python, CONSOLE.WRITELINE() for C#, COUT for C++. Five ecosystems that agree on almost nothing — typing discipline, memory models, package managers, whether semicolons are a moral issue — and yet here they are, one Ranger team, united by the most primitive observability primitive in existence. Meanwhile the DEBUGGER, dressed as Tinky Winky, beams obliviously while the entire team side-eyes him. The casting is vicious and correct: the debugger is the powerful, well-meaning teammate whose presence somehow makes everything weirder.
Why does printf-style debugging keep winning after fifty years of tooling investment? Because its setup cost is zero and its mental model is trivial. A print statement works everywhere the language works: in the container, on the CI runner, inside the lambda, over SSH on the production box you're absolutely not supposed to be on. A debugger, by contrast, demands a negotiation — attach to the right process, get source maps working, convince the IDE the breakpoint isn't a hollow gray circle of despair, pray your optimized build hasn't inlined the function out of existence. Every senior dev has burned thirty minutes configuring a debug session for a bug that three console.log('HERE 1') statements would have found in two.
There's a deeper technical truth too: print debugging and step debugging answer different questions. A debugger excels at "what is the state at this instant?" — but it freezes time, which makes it nearly useless for race conditions, timeout-sensitive flows, distributed requests, or anything where pausing the process changes the behavior (the dreaded heisenbug). Prints give you a timeline — a cheap, append-only trace of execution order across threads and services. That's why the industry's grown-up version of this meme is just print statements with a salary: structured logging, distributed tracing, printf with a span ID. The Rangers didn't reject the debugger out of ignorance. They built their entire production observability stack out of his rival, then acted surprised when he showed up to the huddle.
And yes — the exclusion is also partly cultural shame. Plenty of developers never properly learned their debugger (conditional breakpoints! watch expressions! time-travel debugging!) and cover the gap with bravado. The meme lets everyone laugh at Tinky Winky so nobody has to admit they don't know where the "attach to process" menu is.
Description
A seven-panel comic meme that contrasts different methods of debugging. The first six panels, set against a green background, show the hands of the Power Rangers coming together in a classic team huddle. Each hand is labeled with a command for printing to the console from a different programming language: 'SYSTEM.OUT.PRINTLN()' (Java), 'CONSOLE.LOG()' (JavaScript), 'PRINT()' (Python), 'CONSOLE.WRITELINE()' (C#), and 'COUT' (C++). The final, larger panel shows the Power Rangers looking annoyed and judgmentally at the purple Teletubby, who is cheerfully trying to join their group. The Teletubby is labeled 'DEBUGGER'. The humor stems from the widespread developer habit of using simple print statements for debugging ('caveman debugging') across various languages, while the more sophisticated and powerful tool, the debugger, is often treated as the awkward, out-of-place outsider. It's a relatable commentary on developer workflows and the occasional resistance to using the 'proper' tool for the job
Comments
8Comment deleted
Real developers know the five stages of debugging: Denial, Bargaining, Anger, `console.log('WTF is this value: ', someVar)`, and finally, Acceptance (of using a real debugger)
We’re all Power Rangers of println/console.log until the debugger waddles in asking for symbols - then we remember the service was built with -O3, strip-all, and hot-patched in a Kubernetes pod we can’t exec into
Twenty years in, and I still trust console.log more than the debugger because at least print statements don't mysteriously skip breakpoints in optimized async code running in a containerized environment with source maps three layers deep
Twenty years of debugger innovation, and the industry-standard breakpoint is still console.log('HERE 2 WTF')
After 20 years in the industry, I've learned that the most sophisticated debugging tool is still `console.log('here')`, `console.log('here2')`, `console.log('wtf')`. Sure, your IDE has breakpoints, watch expressions, call stack inspection, and conditional breakpoints with hit counts - but nothing beats the raw, unfiltered dopamine hit of seeing 'IT WORKED' print to stdout at 2 AM. The debugger is like that gym membership: you know you should use it, you paid for it, but somehow `printf` debugging remains your actual workout routine
System.out.println, console.log, print, Console.WriteLine and cout unite; the debugger walks in, drops a conditional breakpoint, and suddenly ‘observability via grep’ feels very 2009
Print statements: one per language to bind them. Debugger: one breakpoint to rule them all - with a Teletubby hug
System.out.println, console.log, print, Console.WriteLine, and cout link arms like Power Rangers; then the debugger waddles in like a Teletubby - cute, but try attaching that to the heisenbug that only reproduces in a Kubernetes pod behind a feature flag