Skip to content
DevMeme
1536 of 7435
The Unwarranted Triumph of Print-Based Debugging
Debugging Troubleshooting Post #1717, on Jun 16, 2020 in TG

The Unwarranted Triumph of Print-Based Debugging

Why is this Debugging Troubleshooting meme funny?

Level 1: Third Place Celebration Analogy

Imagine you’re in a race where the best way to solve a problem is like winning first place, the second-best way is second place, and an okay-but-not-great way is third place. Now picture the person who came in third is jumping up and down, throwing a party, and acting like they won the whole competition. That’s exactly what’s happening in this meme, but for fixing computer bugs!

In simple terms:

  • Reading the instructions (like the manual for a toy or game) is the first-place winner. It’s the smartest way to fix something because it tells you exactly what to do.
  • Using a special tool to find the problem (like a magnifying glass or a step-by-step helper) is second place. It’s also a good way, just a bit less direct than reading the instructions.
  • Just trying things out by trial-and-error (like randomly pushing buttons to see what happens, or shaking a broken remote to figure it out) is the third-place method. This is like using print statements in code – you’re basically guessing and checking.

Now, the funny part: the guy representing that guess-and-check method (third place) is celebrating like crazy – biting his medal, spraying champagne – as if he did something amazing, even though two better solutions are literally standing right above him! It’s like a kid who got third in a science fair but is acting like they won first prize, high-fiving everyone.

Why is this humorous? Because it’s showing how developers often behave when fixing bugs. The quick but messy method (just printing out what’s going on in the program) gives a rush of happiness when it works – so the developer feels victorious and celebrates. Meanwhile, the truly best method (reading the docs or proper guide) was there all along, quietly being the real champion, and a pretty good method (using a debugger tool) was also ahead, but neither got the fanfare.

So in everyday terms, this meme says: sometimes we get way too excited about solving a problem the hard way, when the easy, correct answer was sitting right in front of us (in a book or manual we ignored). It’s poking fun at that human tendency to skip the instructions, do it our own wacky way, and then cheer as if we’re heroes for finally getting it to work. Just like a third-place racer throwing a huge celebration, it’s silly and relatable — and that’s why it’s funny!

Level 2: The Debugging Podium Explained

Let’s break down the three “competitors” on this debugging podium and why each gets its place:

  • 🥇 Reading the Documentation (1st place) – This represents actually reading the manual or official docs of the software, API, or system you’re using. Documentation is where the creators or maintainers explain how things are supposed to work. For example, if you’re using a library and something isn’t working, the docs might have a section or example that clarifies the correct usage. Reading the documentation is the gold standard because it often helps you understand the problem at a fundamental level. It’s like getting the answer key or the map to a treasure: you might find that the “bug” isn’t a bug at all but a misunderstanding, or you discover a proper way to do what you want. In practice, a lot of bugs and confusions vanish once you RTFM (Read The Fine Manual, as developers jokingly say). The meme puts this in first place to remind us that the answers are often already written down if we take time to look.

  • 🥈 Interactive Debugger (2nd place) – The silver medal goes to using an interactive debugger. This is a tool (commonly built into IDEs like Visual Studio, IntelliJ, or browsers for JavaScript) that lets you run your program step-by-step. You can set breakpoints (pausing the program at certain lines), inspect variables’ values at runtime, and see the flow of execution. For instance, if a function returns the wrong value, you can use a debugger to jump into that function call, see each line execute, and watch how the variables change. An interactive debugger is more systematic than print statements because you don’t have to guess where to put prints – you can explore freely. It’s in second place here: extremely useful and powerful (most pros rely on it heavily), but perhaps requiring a bit more knowledge and setup than a quick print. In the meme, the “Interactive Debugger” character stands on the second-highest podium spot, acknowledging it as the second-best method for Debugging & Troubleshooting. Many junior devs eventually learn to use debuggers when projects get complex, because printing dozens of lines just doesn’t cut it for big applications.

  • 🥉 Print Statements (3rd place) – The bronze medal (third place) is print statement debugging, sometimes just called printf debugging or using console.log (in web dev). This is the habit of adding simple output statements in code to check if certain lines are reached or what certain variables contain at different points. For example, in Python you might do: print("value of x:", x) inside a loop, or in JavaScript console.log("Got response", responseData). These lines will print to the console or log so you can see the program’s intermediate state. Print statements are extremely simple to use – no special tools needed beyond basic I/O – and that’s why developers often fall back on them. It’s quick feedback: run the program and see immediate traces of what’s happening. However, it’s considered a lower-tier debugging strategy (hence third place) because it can be labor-intensive to insert/remove prints everywhere, easy to forget to remove (leading to messy logs), and not as powerful as a real debugger. Also, print statements only show what you asked them to, so if the bug is in a part you didn’t think to print, you’ll miss it. In the meme, “Print Statements” is that overjoyed athlete on the third-place podium who is celebrating wildly. This pokes fun at how developers often rely on prints as if it’s the greatest thing, even though it’s arguably not the best way.

Now, why is the “Print Statements” guy so happy if he’s third? The joke is that developers feel a disproportionate amount of joy and relief when a couple of well-placed print statements finally help squash a bug. Imagine you’ve been stuck on a bug for hours – you add a print("checkpoint A") and print("checkpoint B", someVariable) around a suspicious section of code, rerun the program, and boom: the logs reveal the issue! That eureka moment is pure bliss. You might literally cheer or do a little victory dance, just like the meme’s character. In contrast, Reading the documentation (the rightful winner) quietly prevented or solved the problem in a much more civilized way, and the Interactive Debugger methodically traced it, but neither of those felt as scrappy or thrilling as the quick fix you MacGyvered with raw prints. The meme resonates with common developer behavior: debugging pain often leads us to the easiest possible tool, and we do celebrate when it works, even if it’s not elegant. It’s also hinting at Documentation Aversion – many coders admit they don’t read docs until they’re desperate, preferring to tinker first. So in a newbie’s mind, print debugging might actually seem like the hero that saved the day, hence the over-the-top celebration.

For a junior developer, it helps to learn why the other methods outrank print statements:

  • Reading docs can save you from debugging entirely by giving you knowledge upfront (for example, learning from docs that a function returns NULL in a certain case might explain a crash immediately).
  • Debuggers can catch issues in a single run by letting you inspect everything, rather than adding one print at a time and re-running multiple times.
  • Print statements, while simple, might require many guess-and-check cycles. They are like manual probes you insert blindly until you find the issue. It works, but it’s a bit like searching for a light switch in the dark by bumping into things.

The meme’s imagery of a podium with 1, 2, 3 and the labels is clarifying: if debugging techniques had an Olympics, reading the docs gets gold, using a debugger gets silver, and print statements take bronze. Yet, look who’s acting like the superstar: bronze. It’s a playful reminder for developers at any level that sometimes we irrationally cheer for the less efficient solution simply because it’s our habit or comfort zone. After all, writing a quick print("got here") is so straightforward that it often beats inertia – when you’re stuck, you do the first thing that comes to mind. And when it pays off, you feel on top of the world… until you remember to actually remove those prints (and maybe read the docs next time!).

# Example of "print statement debugging" in action:
def fetch_user_balance(user_id):
    print(f"[Debug] Starting fetch_user_balance for user_id={user_id}")  # Developer inserted debug print
    balance = call_external_service(user_id)
    print(f"[Debug] Received balance={balance}")  # Another debug print
    return balance

balance = fetch_user_balance(42)
print("[Debug] Finished fetching, result:", balance)

In the code above, the developer is using print statements to trace the function’s behavior. They print when the function starts, when the external service returns a result, and after the function call, to verify everything. This is classic print debugging – it helps follow the program’s flow and see values without using a debugger. It’s easy to do in any language, which is why it’s so common. But imagine a complex program with dozens of such prints; it can get out of hand. A proper debugger could let the dev pause at call_external_service and inspect balance directly, and documentation might tell what values to expect, possibly avoiding the need to inspect at all.

In conclusion at this level: the meme contrasts three debugging approaches in a comedic way to highlight developer behavior. DebuggingPain and CodingFrustration often push us toward the path of least resistance (print to console and pray!), and the ecstatic bronze medalist is every programmer feeling like a hero after finally cracking a tough bug at 3 AM with a bunch of printouts. Meanwhile, the quiet winners (docs and debuggers) remind us there are often better, if slightly more effortful, ways. It’s a funny, friendly nudge to level up our debugging game… but only after we’ve had our little celebration. 🎉

Level 3: Bronze Medal Debugger Triumph

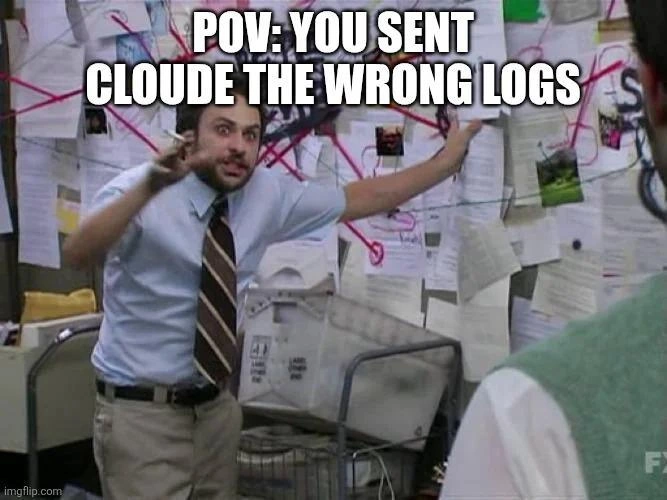
In this meme’s podium of debugging methods, we see a hilarious role reversal: the third-place technique — print statement debugging — is acting like it won Olympic gold. The cartoon of the overly ecstatic bronze medalist (labelled "Print Statements") biting his medal, smooching the presenter, and spraying champagne everywhere is a perfect satire of how developers often over-celebrate a quick-and-dirty fix. Meanwhile, the true first-place winner, Reading the Documentation, and second-place Interactive Debugger stand quietly above on the podium 1 and 2. The humor hits home for any seasoned engineer: we’ve all seen (or been) that coder who skips straight to peppering the code with printf or console.log lines and then revels in triumph when the bug finally reveals itself. It’s like awarding print debugging a gold medal in practice, even though everyone knows it’s, at best, a bronze-worthy solution in the grand scheme of debugging strategies.

Why is this so funny (and painfully true)? Because it lampoons a real Developer Experience (DX) quirk: many engineers have a slight (or not-so-slight) documentation aversion. Instead of calmly reading the manual (which is literally the gold medalist here), or using an interactive debugger (the silver medalist) to methodically step through code, they jump to the fastest hack—sprinkling print statements—and then celebrate like champions when it eventually works. This is a shared industry joke: the gap between best practices and what developers actually do under pressure. Reading documentation requires patience and forethought; using a debugger requires setup and knowledge of tooling; but adding print("got here!") is instant gratification. It’s the software equivalent of a sugar rush. 🍬

From a senior perspective, the meme also pokes at the systemic habits in engineering teams. Perhaps tight deadlines, inherited legacy code, or shaky confidence can lead even experienced devs to reach for the low-hanging fruit of printf-style debugging. We know that reading the documentation could provide a clear blueprint of how the code should work (preventing bugs in the first place), and an interactive debugger could let us inspect state at runtime with surgical precision. Yet, time and again, developers rely on brute-force logging. There’s a shared memory of those late-night debugging sessions where after hours of frustration you add one more print statement and suddenly the problem becomes obvious — in that exhausted moment, you do feel like you won the gold. Cue the champagne. 🥂 It’s a bittersweet celebration though, because in hindsight the documentation or a proper debugging session might have caught the issue sooner. The meme hyperbolically celebrates that messy victory, and every developer who’s been there laughs in recognition.

Subtly, this image highlights the culture of Debugging & Troubleshooting where simple hacks often get more fanfare than disciplined approaches. It’s a tongue-in-cheek critique of how we often reward ourselves for coding solutions that are quick rather than quality. The print_statement_debugging label on the jubilant athlete is a direct callout to this phenomenon. Meanwhile, the stoic figures on the podium remind us that the unsung heroes — thorough documentation reading and proper debugging tools — quietly outperform in effectiveness. The bronze medalist’s antics (like throwing up double middle-fingers in triumph) exaggerate the idea that we proudly rely on print() even while the more elegant solutions stand by. In summary, at the senior level, the meme lands because it’s developer humor reflecting real-world debugging pain: we know the “right” way, but dang if the quick printf fix doesn’t make us feel like kings of the world for a moment, even if we only came in third.

Description

A six-panel comic strip using the 'Bronze Medal Celebration' meme format to satirize developer debugging habits. The first five panels depict a male athlete in a blue and white tracksuit, labeled 'Print Statements,' celebrating ecstatically. He receives a medal, bites it, kisses a woman, flips off the crowd, and sprays a champagne bottle. The final panel reveals a winner's podium. The first-place spot is occupied by a calm athlete labeled 'Reading the Documentation.' The second-place spot has another calm athlete labeled 'Interactive Debugger.' The third-place spot is taken by the overly celebratory athlete, 'Print Statements,' who continues to spray champagne. This meme humorously critiques the tendency for developers to feel immense pride in solving complex problems with the simplest, most primitive debugging tool - print statements - while more effective and sophisticated methods like reading documentation or using a proper debugger are acknowledged as superior but used less enthusiastically
Comments

7
Anonymous ★ Top Pick Using a debugger is like performing surgery with a scalpel; using print statements is like performing it with a sharpened spoon. It's messy, but the feeling of success when you actually find the tumor is unparalleled
  1. Anonymous ★ Top Pick

    Using a debugger is like performing surgery with a scalpel; using print statements is like performing it with a sharpened spoon. It's messy, but the feeling of success when you actually find the tumor is unparalleled

  2. Anonymous

    Print-statement debugging is popping champagne because - two decades in - it’s still the only “debugger” that works after you ssh into a half-crashed prod container with stripped symbols and no docs

  3. Anonymous

    After 20 years in the industry, I've learned that the most sophisticated debugging tool is still console.log() with increasingly creative profanity in the message strings - because at 3 AM during a production incident, nobody has time to remember GDB commands or figure out why the debugger won't attach to the containerized process running in a different namespace

  4. Anonymous

    After 20 years in the industry, I've learned that the most sophisticated debugging tool is still `console.log('here')`, `console.log('here2')`, `console.log('wtf')`. Sure, I could set breakpoints, inspect the call stack, and use conditional watchpoints in my IDE's debugger - but why spend 10 minutes configuring that when I can sprinkle print statements like breadcrumbs through my code in 30 seconds? The interactive debugger sits there, polished and powerful, while I'm already three bugs deep into my investigation with nothing but strategic logging and pattern recognition. Documentation? That's for people who have time to read 47 pages to find one function signature. Print statements don't judge, don't require setup, work in production (don't tell DevOps), and most importantly - they're already muscle memory from debugging that segfault in C back in 2003

  5. Anonymous

    Print statements claim gold - zero setup, prod-deployable, and they reveal state faster than any breakpoint ever promised

  6. Anonymous

    Printf keeps winning because it attaches over SSH to a flaky k8s pod, needs no symbols, and never argues about breakpoints - right up until Finance asks why ELK is our largest customer

  7. Anonymous

    Print statements: bronze on the architecture slide, gold at 3 a.m. - the only debugger that survives containers, RBAC, and reality

Use J and K for navigation