Skip to content
DevMeme
3674 of 7435
Debugger Shame Spiral
Debugging Troubleshooting Post #4013, on Dec 10, 2021 in TG

Debugger Shame Spiral

Why is this Debugging Troubleshooting meme funny?

Level 1: Pausing The Movie

It is funny because the person is afraid to ask about a tool that would make their work easier. A debugger is like pausing a movie to see exactly what happened in one scene, while print statements are like watching the whole movie again and writing down clues whenever someone says something important. Both can help, but pausing is a lot less exhausting.

Level 2: What A Debugger Does

A debugger is a tool that lets a developer pause a running program and inspect what is happening. Instead of guessing from output, you can stop at a specific line, look at variable values, move through code one step at a time, and see the call stack that explains how the program got there.

Common debugger features include:

  • Breakpoints: markers that pause the program at a chosen line
  • Step over: run the next line without entering a called function
  • Step into: enter a function call to see what happens inside
  • Watch expressions: values the debugger keeps showing as the program changes
  • Call stack: the chain of function calls that led to the current point

Print statements are the simpler alternative. A developer inserts lines like print(user_id) or console.log(response) to see values during execution. That works well for quick checks, and logs are still important in production systems. The problem is that print debugging becomes clumsy when the bug depends on timing, nested state, loops, exceptions, or values that change several times. A debugger gives you control over time; print statements mostly give you a transcript after the fact.

For juniors, the important lesson is that using a debugger is not cheating and not a sign of weakness. It is just another piece of Tooling, like an editor, test runner, formatter, or terminal. The awkward part is learning the buttons and mental model, not becoming worthy of the tool.

Level 3: Breakpoints And Shame

The meme confesses the quiet thing many developers carry around longer than they admit:

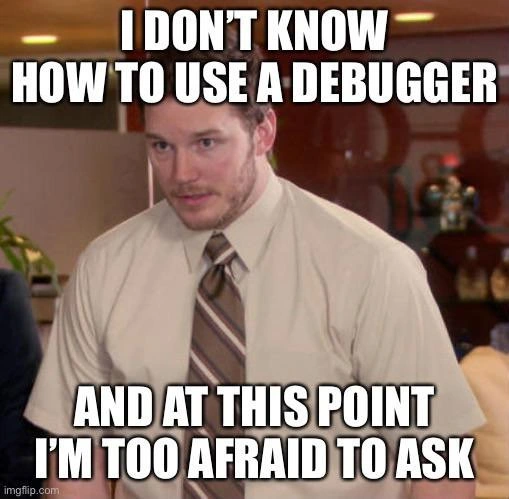
I DON'T KNOW HOW TO USE A DEBUGGER

AND AT THIS POINT I'M TOO AFRAID TO ASK

The post caption, Print statements do "brrr", completes the confession. This is not really about ignorance. It is about DeveloperAnxiety around a tool that everyone acts like everyone else already learned. Debuggers are powerful, but they also expose a weird social gap: some people were taught breakpoints, stack frames, watches, conditional stops, and step-through execution early; others survived with print, logs, and vibes until asking felt embarrassing.

The senior-level pain is that print debugging is both bad and good, which is why the habit survives. Logging a value is fast, language-agnostic, works in many environments, and leaves behind evidence. But once a bug involves state changing across several function calls, async callbacks, request boundaries, threads, transactions, or UI events, print statements turn into breadcrumbs scattered through a storm. You rerun, add another print, rerun, realize the branch did not execute, add three more, rerun, and eventually your "temporary" diagnostics are a hand-rolled debugger with worse controls and more cleanup.

The shame spiral is also organizational. Teams will demand faster root-cause analysis while never budgeting time to teach tooling. IDEs ship with excellent DebuggingTools, but onboarding often covers ticket workflow, deployment rituals, and where the sprint board lives before it covers how to inspect a live call stack. So the developer in the image looks tense because the technical question has become an identity question: "If I ask this now, will everyone discover I have been faking competence?" The cruel answer from experience is that half the room has also been faking one part of the toolchain. They just picked a different part.

Description

The image uses the "At this point I'm too afraid to ask" meme format, showing a man in an office wearing a shirt and tie while looking tense and uncertain. Large white all-caps text with black outline at the top reads, "I DON'T KNOW HOW TO USE A DEBUGGER." Matching text at the bottom reads, "AND AT THIS POINT I'M TOO AFRAID TO ASK," with a small imgflip.com watermark in the lower-left corner. The technical humor comes from a common developer confession: many people rely on print statements, logs, or guesswork long after a debugger would make the failure mode obvious.

Comments

4
Anonymous ★ Top Pick Print debugging works right up until your log file becomes the debugger you were trying not to learn.
  1. Anonymous ★ Top Pick

    Print debugging works right up until your log file becomes the debugger you were trying not to learn.

  2. @NoCountryForOldBuffet 4y

    we had to learn valgrind for a C course (I think Systems Architecture?), and honestly it was a really awesome tool but it's so fucking obtuse and hard to manage that it's so tempting to just go back to print statements when you're spending more time figuring out how to even work the debugger than actually thinking about debugging

    1. @GaggiX 4y

      But Valgrind is not a debugger And I think it's pretty easy to use

      1. @GaggiX 4y

        Not a debugger in a general sense

Use J and K for navigation