The Unmoving Burndown Chart
Why is this Agile meme funny?
Level 1: Empty Chore Chart
Imagine your teacher made a big chart on Monday to track how many homework assignments the class finishes by Friday. Each day, she’s supposed to cross off the assignments you’ve completed – the chart should go down as the week goes on. But now it’s Wednesday, and guess what? The chart hasn’t changed at all. It’s still full, as if nobody did any homework yet. Your teacher gets nervous. She points at the chart and then at the class, asking, “Why is nothing done? Who isn’t doing their work?” She’s acting a bit like the worried project manager in the meme. The chart not moving makes her think no one is making progress, and she starts trying to find someone to blame. It’s a funny picture because we know everyone is probably working, but seeing the teacher (or the manager) freak out just because a chart didn’t change is a little silly. It’s like when Mom checks the chore chart mid-week and still sees zero stickers – she might point at you and your siblings, worried that nothing’s been done, even if you were about to do it. The humor comes from that over-the-top reaction to an unmoving chart: we get why they’re worried, but we also laugh because pointing fingers doesn’t magically make the work done any faster!
Level 2: Burndown Breakdown
Let’s dial it back and explain what’s going on here. In Agile development (specifically the Scrum framework), teams work in short cycles called sprints (often 1 or 2 weeks long). At the start of a sprint, the team plans a set of tasks or user stories they aim to complete – this is SprintPlanning. As work progresses, one common agile_metric used to track progress is the burndown chart. This chart is basically a line graph with time on the X-axis (sprint days) and remaining work (like story points or task count) on the Y-axis. Each day, as the team finishes work, the line “burns down” towards zero.
Now, if the team is finishing tasks steadily, the burndown line slopes downward day by day. But sometimes you get a flat line – meaning day after day, the remaining work number doesn’t drop at all. That’s what “burndown doesn't move” refers to: the chart is stuck. Maybe the tasks are all in progress but none fully completed yet, or the team hasn’t updated the tracker. Whatever the cause, to a worried Project Manager it looks like nothing is getting done. The meme shows exactly that reaction: the PM is instantly alarmed, pointing at the chart (or figuratively at the team) as if to say, “Look! No progress! What’s happening?” It’s a humorous exaggeration of how managers might respond under deadline pressure.
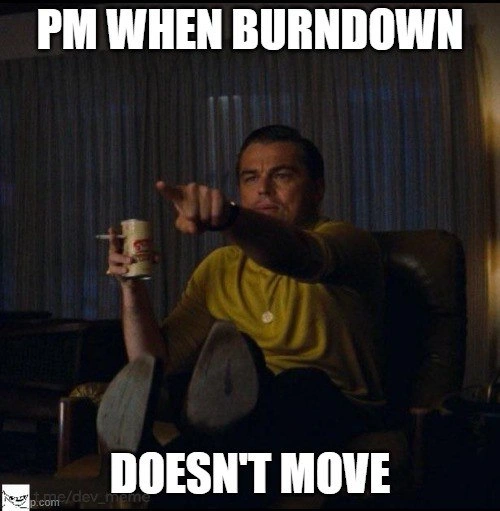
In real life, a good PM or Scrum Master would see a flat burndown as a sign to gently check in: is there a blocker? Were tasks estimated too optimistically? Does the team need help? But the joke here is that some managers skip straight to finger-pointing. The image of the man on the couch (actor Leonardo DiCaprio from a popular meme template) captures a PM’s knee-jerk instinct to call out someone when metrics look bad. The top text “PM WHEN BURNDOWN” and bottom text “DOESN'T MOVE” is written in big white capital letters (a common meme style) to label this scene. It translates to: “This is the Project Manager when the sprint’s burndown chart isn’t changing.”
It’s funny to developers because it’s a scenario we recognize and maybe have satirized before. The tags like AgileHumor and ProjectManagementHumor exist because, while Agile is supposed to be about adaptability and trust, in practice we often encounter these comical moments of panic over charts and numbers. Team_velocity (how much work a team completes each sprint on average) and other metrics are useful, but they can cause stress when managers treat them like a strict scoreboard. The lack_of_progress shown by a flat burndown can have many innocent explanations – maybe tasks are 90% done but not marked complete, or the team is focusing on a big item that will only burn down at the end. However, the meme highlights the human element: the PM’s eyes are glued to that chart, and they can’t help but react. This often leads to a tense daily standup_scrum meeting where devs have to explain why the chart hasn’t budged, even if actual work is happening behind the scenes. The humor (and slight pain) comes from how spot-on this portrayal is. We laugh because we’ve either seen that pointed finger or felt its pressure ourselves, and it’s a relief to know we’re not alone.
Level 3: The Burnout Chart
Nothing triggers Agile anxiety quite like a burndown chart flatlining mid-sprint. The meme perfectly captures this moment: a PM (Project Manager) perched on the couch, drink in hand, suddenly leaning forward and pointing at the screen in alarm – just like Leonardo DiCaprio’s famous pointing scene. The top/bottom text “PM WHEN BURNDOWN DOESN'T MOVE” frames the classic scenario. This is Agile pain point humor at its finest, because anyone who’s survived a few Scrum cycles knows exactly what’s coming when that line of remaining work refuses to dip.
In a healthy world, a Sprint burndown chart is supposed to steadily slope downward as the team completes tasks. It visualizes team_velocity – how fast story points burn down each day. But in reality, progress often comes in bursts: nothing seems to happen for days (flat line), then a bunch of tasks close at once right before the deadline (sudden drop). To an experienced developer, a mid-sprint plateau isn’t automatically cause for panic; it might mean work is in progress but not formally finished yet. Maybe the team tackled a huge refactor or integration test that doesn’t show up as “done” on the chart today. Unfortunately, many PMs see a flat burndown and immediately break out in a cold sweat. It’s like a heart monitor flat-lining: lack_of_progress equals looming disaster in their eyes. The meme nails this overreaction with the PM’s dramatic pointing pose – “Hey, you! Yes, you – why isn’t anything done yet?”
This image riffs on a very real dynamic: DeadlinePressure meets metric obsession. Under the hood, it’s highlighting a bit of dysfunction in Agile management. Rather than calmly investigating blockers or helping the team, a panicked manager might start a blame game. The cynical humor here is that pointing fingers doesn’t make code ship any faster – if anything, it creates a culture of fear and frantic Scrum stand-ups. The veteran dev in us chuckles (perhaps darkly) because we’ve seen it before: the moment a sprint’s agile_metrics don’t behave, some managers flip from servant leader to taskmaster. It’s funny in the meme, but in real life it can be a burnout chart – morale and trust erode as quickly as that burndown is supposed to.
Let’s break down why this resonates in the dev community:
- Stand-up turns into a grilling: The daily standup_scrum meeting suddenly feels like an interrogation. The PM, much like the pointing figure in the meme, zeroes in on team members: “We’re halfway through the sprint and nothing’s closed. What’s going on, team?” Every developer braces themselves. This is a common AgilePainPoints moment – instead of collaboration, it’s pressure.
- Micromanagement mode engaged: A flat chart can send some PMs into overdrive. Cue the barrage of update requests and extra status meetings. They’ll hover over the issue tracker (Jira, Trello, take your pick) hitting refresh like it’s a Twitch stream, hoping a task magically moves to “Done.” It’s ProjectManagementHumor because we know tasks don’t complete faster just because someone’s pointing at them on a graph.
- Scapegoating and frantic fixes: In the worst cases, the PM might single out a “slow” developer – exactly what the meme implies with that pointed finger. Or they’ll start fiddling with scope and priorities mid-sprint, thinking that will get the line moving. We chuckle because we’ve seen heroic last-24-hour efforts to make the chart look good, including developers pulling late nights just to avoid uncomfortable conversations. (We’ve all
pushed code at 2 AM“optimized workflow” to appease a chart, right?)
The senior perspective recognizes the satire here: obsessing over a burndown chart is a management_PM anti-pattern. Agile metrics like burndowns and team_velocity are meant to help teams predict and adjust, not to be weapons for blame. But too often they become an AgileHumor trope – the anxious manager treating the sprint chart as gospel. The meme is funny because it’s true: we laugh, remembering that one sprint where our PM literally pointed at a graph on the wall during stand-up with that exact face, demanding to know why it wasn’t trending down. This shared experience is equal parts ridiculous and relatable. It emphasizes a hard-earned lesson from the trenches: progress isn’t always linear, and freaking out won’t make it so. In short, the “burnout chart” moment shown here is a wink to every developer who’s had a manager treat a simple graph like a rocket launch countdown, complete with finger-pointing and rising blood pressure.
Description
This meme uses the 'Pointing Rick Dalton' format, featuring a still of Leonardo DiCaprio from the film 'Once Upon a Time in Hollywood'. He is sitting in a chair, holding a drink and a cigarette, pointing at something off-screen with a look of recognition. The text overlay reads, 'PM WHEN BURNDOWN DOESN'T MOVE'. This meme humorously depicts the moment a Project Manager (PM) notices that the sprint's burndown chart is flat, indicating no progress is being made on the remaining work. The joke resonates with developers who have experienced the pressure of a PM scrutinizing agile metrics, where the simplicity of the chart often belies the complex reasons for a project's stagnation, such as unforeseen technical debt, blockers, or inaccurate estimates
Comments
7Comment deleted
A flat burndown chart is a PM's version of a compiler error. They just point at it, assuming the problem is obvious, while the engineers know the real issue is a cryptic segmentation fault in the staging environment
Burndown’s gone horizontal, so the PM flips on distributed tracing - somehow every span terminates at my Jira ticket
The PM's expression when they realize the burndown chart has been a horizontal line for three days straight, but the team insists they're 'almost done' with everything - a phenomenon known in the industry as 'Schrödinger's Sprint Progress'
When your burndown chart has been a horizontal line for three days straight and you realize the team has been 'investigating' that one story point ticket since Monday - at this point, you're not managing a sprint, you're managing a marathon where everyone's taking a very long water break. The PM's thousand-yard stare says it all: they've seen this chart in five retrospectives, promised to address blockers, and yet here we are again, with 40 story points still 'in progress' on the last day of the sprint
PMs expect burndown like clockwork; devs deliver eventual consistency across timezones
The burndown’s flat because this sprint is an append-only log - stop expecting deletes while product keeps emitting new events
PM when the burndown doesn’t move: re-estimate, split the tickets, switch to burn-up - Goodhart’s law says we can ship the metric even if we can’t ship the feature