Skip to content
DevMeme
7431 of 7435
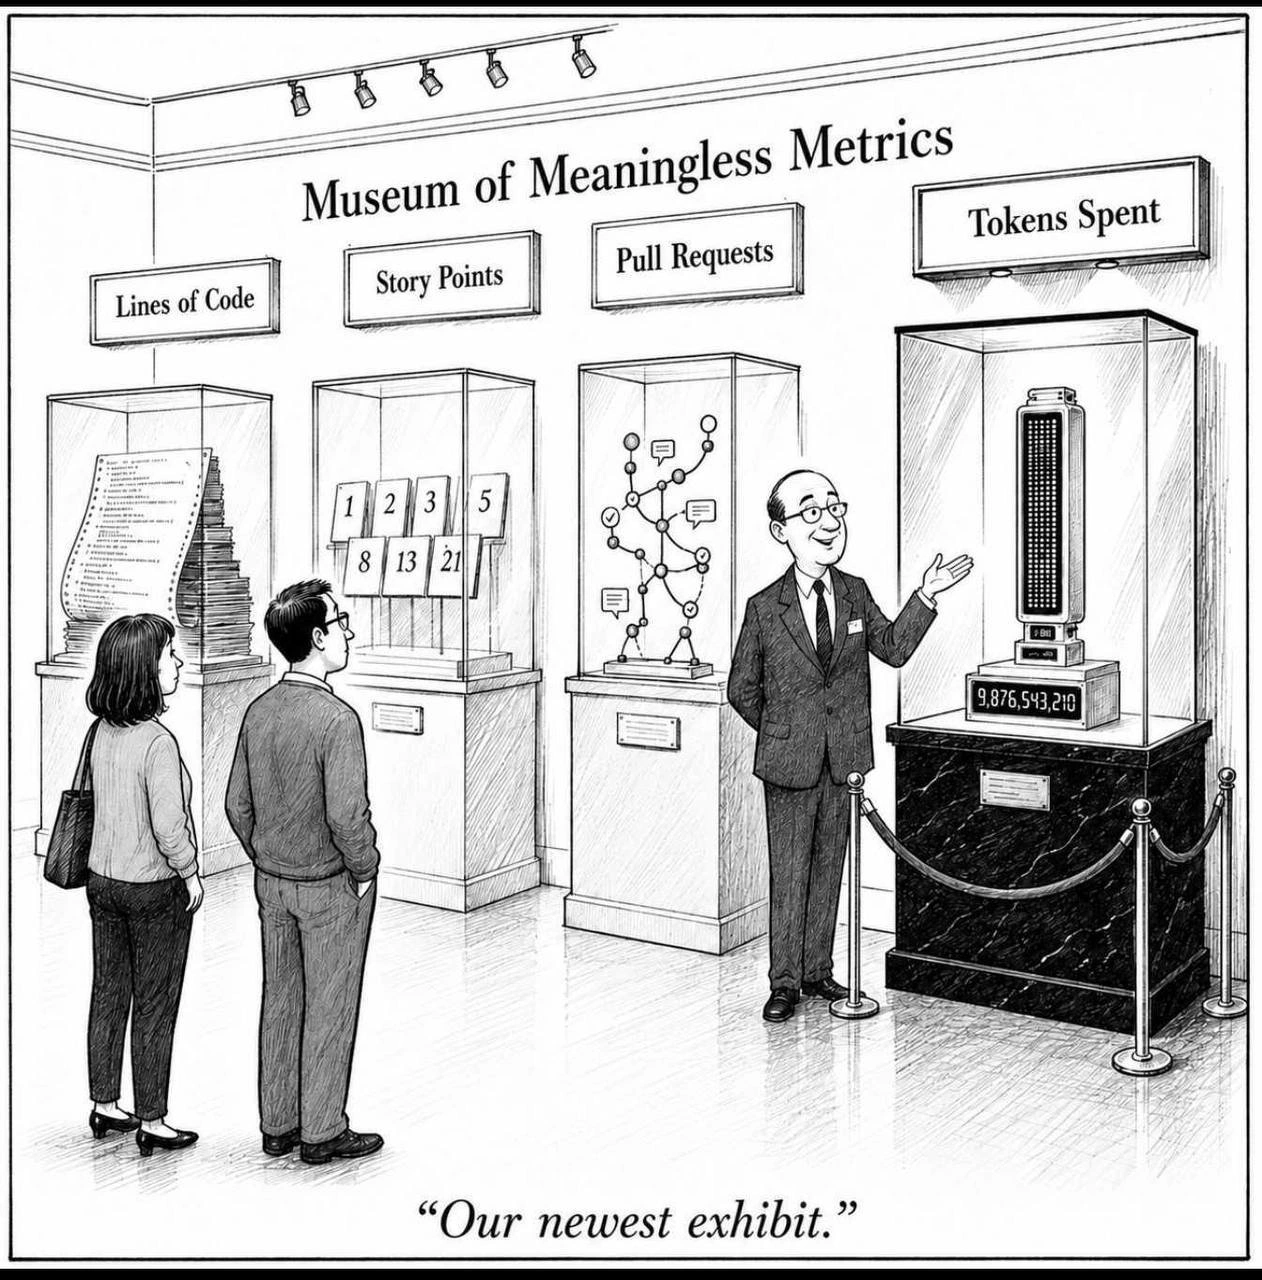
Museum Of Meaningless Metrics
DeveloperProductivity Post #8143, on Jun 19, 2026 in TG

Museum Of Meaningless Metrics

Why is this DeveloperProductivity meme funny?

Level 1: The Sticker Chart Problem

This is like judging students by how many pencils they used, how many sticky notes they wrote, or how many times they raised their hands. Those things can tell you something happened, but they do not prove anyone learned anything useful. The funny part is that the tech world keeps putting new labels on the same bad habit: counting what is easy instead of what matters.

Level 2: Counting The Wrong Thing

Lines of code are the amount of code written. More code is not automatically better; sometimes the best fix removes code. Story points are estimates teams use in Agile planning to describe effort, uncertainty, or complexity. They are supposed to help a team plan its own work, not become a universal performance currency.

A pull request is a proposed code change that other developers can review before it is merged. Counting pull requests can show activity, but it does not tell you whether the changes were important, correct, maintainable, or necessary.

Tokens are chunks of text processed by an AI model. AI assistants often charge, limit context, or report usage based on tokens. So Tokens Spent is a new metric that sounds technical and objective, but it can be misleading if treated as productivity. Spending many tokens might mean solving a hard problem, or it might mean the tool got lost. Spending few tokens might mean efficiency, or it might mean the AI skipped the hard thinking.

The joke is that the museum guide is proud of the newest display, but the audience is supposed to recognize it as the same old mistake in modern packaging.

Level 3: Goodhart's Gift Shop

The museum wall says "Museum of Meaningless Metrics", and the exhibits are a brutally accurate little history of engineering management theater:

Lines of Code

Story Points

Pull Requests

Tokens Spent

The guide presents the token counter with the caption:

Our newest exhibit.

That is the whole wound, neatly framed in glass. Software organizations keep discovering numbers that are easy to collect, then pretending those numbers are the same as value. The meme puts Tokens Spent beside Lines of Code, Story Points, and Pull Requests because each metric can be useful in a narrow context and poisonous when promoted into a productivity scoreboard.

The senior-developer reading is pure Goodhart's law: when a measure becomes a target, it stops being a good measure. Lines of Code can indicate activity, but rewarding it encourages bloat. Pull Requests can show collaboration, but counting them encourages tiny performative changes or review churn. Story Points can help a team estimate uncertainty, but management often launders them into fake velocity math. Now LLM tooling adds tokenization to the trophy case: how many tokens did the assistant consume, how many did the team save, how much did this feature "cost" in model usage, and why is the dashboard suddenly more confident than the engineers?

The token display reading 9,876,543,210 is funny because it looks prestigious and absurd at the same time. A huge token count might mean a team did useful AI-assisted work. It might also mean the assistant reread the same files repeatedly, generated throwaway drafts, wandered through context, or spent money converting uncertainty into logs. The number is real, but the interpretation is where the trap opens.

This is also a ManagementVsEngineering joke. Managers want aggregate visibility because invisible work is hard to plan, budget, or defend. Engineers distrust aggregate visibility because they know the work is mostly context: deleting a dangerous abstraction can be more valuable than writing a thousand lines, and one careful review can prevent more damage than a dozen merged pull requests. The meme's museum format says these lessons are not new. We already preserved the fossils. Naturally, we are still buying tickets.

Description

A black-and-white cartoon shows a museum gallery labeled "Museum of Meaningless Metrics" across the back wall. Four exhibit cases are labeled "Lines of Code," "Story Points," "Pull Requests," and "Tokens Spent"; the first contains a huge stack of printed code, the second shows cards with Fibonacci-like estimates "1, 2, 3, 5, 8, 13, 21," the third displays a branching pull-request diagram, and the fourth features a pedestal counter reading "9,876,543,210" under a tall token-meter-like object. Two visitors look on while a smiling museum guide gestures toward the "Tokens Spent" display, and the caption at the bottom says: "Our newest exhibit." The technical joke is that engineering organizations keep inventing measurable proxies for value, and LLM-era token burn has joined lines of code, story points, and PR counts as another easy-to-track but easy-to-misuse metric.

Comments

10
Anonymous ★ Top Pick Goodhart's law finally got a token budget and immediately became a dashboard.
  1. Anonymous ★ Top Pick

    Goodhart's law finally got a token budget and immediately became a dashboard.

  2. @deimossos 3w

    (Ai slop)

    1. @pulsar_sp 3w

      this

  3. @deadgnom32 3w

    where is USCS?

  4. @NickRaspy 3w

    what's the story points

    1. @NaNmber 3w

      ah such a blissful ignorance 😏

    2. @b7sum 3w

      https://atlassian.com/agile/project-management/estimation tl;dr a measure for some task's value

    3. Егор 3w

      another failed attempt at creating estimates that are real

  5. Arvid 3w

    MIPS is missing, and Watts PMPO

  6. @Rivet92 2w

    Wait till someone starts yo mix them up tokens/line of code or pull requests/SP

Use J and K for navigation