The Long and Winding Road to a Segmentation Fault
Why is this Bugs meme funny?
Level 1: Not My Fault
Imagine a group of kids in a classroom who accidentally broke a toy, and now none of them wants to take the blame. One kid points at his friend and says, “It wasn’t me, it was his fault!” That friend points to another kid, “No, she did it!” The next kid points to someone else, saying, “Not me – maybe the instructions were wrong!” Then the blame even goes to the tools: another kid says, “I think the crayons we used to build it were bad.” The last kid in the circle points back to the first kid, “Actually, I bet you started it!” Now they’ve made a complete circle with their pointing fingers, and everyone is saying “Not me!” Meanwhile, the poor toy is still lying there broken. The teacher (or the adult in charge) is left holding the broken pieces, feeling frustrated. It’s funny in a silly way: everyone is so busy blaming each other (and even blaming the materials and instructions) that nothing gets fixed. This is just like what’s happening in the meme – every part of the process is blaming the next, and in the end, the developer is left with a big error and a frown, muttering “It’s not my fault!” even though, well… the problem still needs to be solved. It shows how we sometimes react when something goes wrong: we point fingers in a circle, but that doesn’t make the problem go away.
Level 2: Blame Game Breakdown
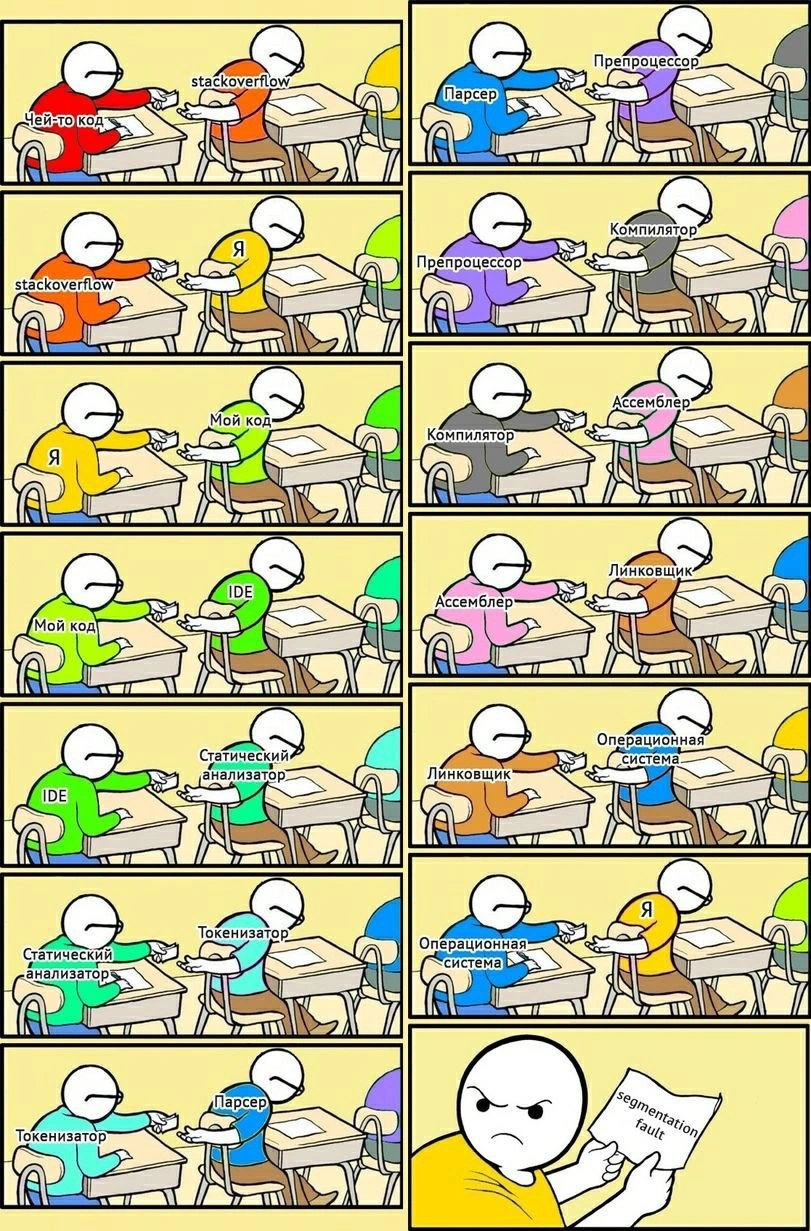
Let’s break down the meme in simpler terms and explain who all these blame targets are, especially for those newer to programming. The comic panels show a sequence of stick-figure characters in a classroom, each labeled with something (in Russian, but we’ll translate), pointing to the next. Each label is basically a part of the software development process or ecosystem. Here’s what each one means:
“Чей-то код” – Someone’s code (Red shirt): This represents code written by somebody else, not by you. It could be a third-party library you used, a module written by another developer on your team, or just some snippet you found somewhere. It’s human nature (and common among new devs) to first suspect that if something broke, it’s probably in the part of the code we didn’t write. So “someone else’s code” is the first scapegoat: “Maybe the bug is in that library function I called, not in my code.”
“stackoverflow” (Orange shirt): This refers to Stack Overflow, the famous Q&A website where developers post questions and answers. It’s a go-to resource for debugging and finding solutions. Many developers copy-paste code from Stack Overflow answers when they’re stuck. The meme humorously personifies “Stack Overflow” as a student in the class. Why blame Stack Overflow? Because if you grabbed a code snippet from there and it caused a problem, you might think, “Ugh, that code from StackOverflow is wrong!” In reality, the code might have been fine in its original context – maybe you integrated it incorrectly – but it’s an easy target for blame when you’re frustrated.
“Я” – Me (Yellow shirt): This is the developer themself – you, the person writing and running the code. In the chain, Stack Overflow is pointing at “Me,” suggesting that perhaps the Stack Overflow snippet is saying “It’s actually your fault for using me wrong.” Now, the character “Me” (the developer) doesn’t want to take the blame either, so they point to the next one: “Мой код.”
“Мой код” – My code (Green shirt): This is literally the code I wrote. It sounds funny that “Me” and “My code” are split into two separate entities, but it reflects how developers sometimes think of their code as if it’s separate. The developer might say, “It’s not me that’s flawed, it’s my code that’s buggy!” Now “my code” doesn’t want the blame either, so where to point? The next culprit in line is the IDE.
IDE (Purple shirt): IDE stands for Integrated Development Environment. Examples include Visual Studio, IntelliJ IDEA, VS Code, Eclipse, etc. It’s the software application we use to write and sometimes compile/debug our code. Blaming the IDE might happen like: “Maybe the IDE didn’t compile the latest changes,” or “The debugger isn’t showing the right info,” or “There’s a weird plugin in my IDE messing things up.” It’s not the most common blame target, but when you’re truly stumped, you start questioning your tools. In the meme, the “IDE” character passes the blame along to the static analyzer.
“Статический анализатор” – Static analyzer (Teal/Aqua shirt): A static analyzer is a tool that examines your source code without running it, to find potential bugs or bad practices. Think of it like a grammar checker but for code – it can warn about things like “variable is unused” or “this pointer might be null here.” Examples: ESLint for JavaScript, Pylint for Python, or more advanced ones like Coverity or static analysis built into compilers (with flags like
-Wallin GCC for warnings). In the blame chain, the idea is “My IDE didn’t catch it, maybe the static analysis tool should have warned me but didn’t.” So the static analyzer character points to the tokenizer next.“Токенизатор” – Tokenizer (Blue shirt): The tokenizer (or lexer) is part of the compiler. It’s the first phase of turning your written code into something the machine can work with. The tokenizer’s job is to scan your code text and break it into tokens – basically words and symbols (like identifiers, keywords
if,while, operators like+, etc.). It’s very basic: it doesn’t understand context or meaning, it just categorizes substrings of your code. It’s unlikely to be at fault for a bug because if it mis-tokenized something, the program simply wouldn’t compile correctly. But the meme throws it in the chain to be thorough (and humorous). The tokenizer blames the parser next.“Парсер” – Parser (Dark blue shirt): The parser is the next stage in a compiler. After tokens are identified, the parser analyzes the sequence of tokens according to the language’s grammar rules to figure out the structure (like which tokens form an expression, which form a statement, etc.). If something’s syntactically wrong in the code, the parser will error out (giving you those compile errors like “expected ; before }” and so on). If the code compiles, the parser likely did its job fine. Blaming the parser for a runtime bug is again far-fetched, but in the chain of blame, it’s the next link. The parser hands off blame to the preprocessor.
“Препроцессор” – Preprocessor (Violet/Purple shirt): The preprocessor is a tool (mostly in languages like C and C++) that runs before the actual compilation. It handles directives like
#include(inserting libraries or other files),#define(macro substitutions), and conditional compilation (#ifdef ...). It literally processes your source code text to produce a modified source that the compiler then compiles. Macros can introduce errors if misused (imagine a macro that expands in a way you didn’t expect), so developers sometimes do blame weird bugs on “some macro gone wild.” So in our meme, the preprocessor is a plausible scapegoat for a confusing bug: “Maybe some macro replaced something incorrectly.” The preprocessor then points to the compiler.“Компилятор” – Compiler (Gray shirt): The compiler is the program that takes your high-level source code and translates it into low-level machine code (or an intermediate like bytecode). If you’re using C/C++, this is what produces the
.oor.objfiles from your.cor.cppsources. In other languages like Java or C#, the compiler produces bytecode for the JVM or .NET runtime. We’ve now reached a very common blame target: “It must be a compiler bug!” As mentioned earlier, it’s almost never the case for mainstream compilers, but it’s a thought that has crossed every developer’s mind when they’re absolutely baffled by a bug: “I swear my logic is sound – could the compiler be optimizing it incorrectly or something?” In the chain, the compiler character deflects blame to the assembler.“Ассемблер” – Assembler (Pink shirt): An assembler takes the assembly output from the compiler and converts it into actual machine code (binary). In many build processes, the “assembler” is invoked behind the scenes by the compiler itself (so you don’t usually run an assembler manually unless you’re writing pure assembly code). Blaming the assembler for a program’s bug is extremely uncommon – assemblers are simple and very battle-tested. But for completeness (and comedy), the meme includes it. “Assembler” points to “Линковщик” – the Linker.
Linker (“Линковщик”, Brown shirt): The linker’s job is to combine all generated machine code and resolve references. For example, if your code calls a function that lives in another file or library, the compiler leaves a placeholder, and the linker later fills it in with the address of that function. If you’re using libraries (like
.dll,.so, or.libfiles), the linker makes sure all the needed pieces are included in the final executable. A linker error usually prevents the program from even running (you’d get an error at build/link time). However, if, say, the wrong version of a library was linked, you might get a runtime crash due to mismatches. So sometimes developers do have to troubleshoot linking issues (often manifesting as crashes or strange behavior). In the blame hierarchy, it’s rare but not impossible to consider: “Did I link the right library? Is there a mismatch causing this crash?” The linker in the comic finally points to the Operating System.“Операционная система” – Operating System (Cyan shirt): The OS is the environment in which your program runs. It manages resources like memory, CPU, and devices. If something goes wrong at runtime, you might joke, “This OS is garbage!” or “There must be something wrong with Windows/Linux/whichever OS.” In truth, a segmentation fault is the OS doing its job: it’s preventing your program from corrupting memory. Operating systems aren’t perfect – they have bugs too – but if your app crashes with a segfault, it’s extremely likely the fault of the app, not the OS. The OS basically enforces the rules and then figuratively goes, “It’s your problem now.” In the meme, the OS character points back at “Me” (the developer), completing the blame circle.
Segmentation fault (the paper in final panel): This is the end result – the error message the developer gets. It literally means the program tried to access a memory segment that wasn’t allowed, and it faulted (crashed). It’s often abbreviated as segfault. In practical terms, it’s one of the most dreaded types of bugs because it doesn’t tell you where or why it happened – only that it did. You usually have to use a debugger or add a lot of logging to find the line of code that caused it. In the final panel, the developer’s angry face and the text “segmentation fault” sums up the experience: after all that finger-pointing, the developer is left holding the error report, with no more excuses – just the reality that something went wrong and needs debugging.
Notice the meme labels were in Russian (perhaps the meme originated in a Russian dev community), but as we’ve translated, the roles are universal – any programmer, in any language (both human and programming language), can relate to these stages. The classroom setting with students passing blame is a visual metaphor: each part of the system says “It’s not me, check that other guy!” The humor and insight here come from how it exaggerates the blame passing that can happen during troubleshooting.
For a junior developer, it’s also an inadvertent tour of the entire compilation process and environment: you get to see all the major stages that take your code from text to a running program: writing the code, using an IDE, checking it with analyzers, compiling (which involves tokenizing, parsing, etc.), assembling, linking, and then running on an OS. In a way, it’s a funny introduction to those concepts. And it underlines a practical lesson in debugging: always consider that the bug might be in your own code logic before blaming external tools or libraries. Those external things can fail, but it’s far more common that the mistake lies in our code or how we used those tools.
So, if you find yourself in this situation (segfault or similar bug):
- Take a deep breath.
- yes, you might feel like blaming StackOverflow or the compiler, but systematically check your own code and assumptions first.
- Use proper debugging tools (like running the program in a debugger to see where it crashes, or adding prints/logs, etc.).
- None of the layers in this chain are magic – each can be understood and verified to some extent. For example, you can enable more warnings in your compiler (
-Wall -Wextrain GCC/Clang), use dynamic analysis tools like valgrind or AddressSanitizer to catch memory errors, etc., to help pinpoint the issue.
The meme, in a lighthearted way, reminds us that software bugs – especially nasty ones like segfaults – often trigger an emotional response (denial, frustration), but the solution is always to methodically trace through the problem. No matter how advanced your environment, no single tool catches everything. In the end, it circles back to the developer’s responsibility to debug and fix the problem. After all, computers and compilers are just doing what we told them to do – if we told them wrong, we get a crash. Or as an experienced dev might say with a wry smile: “To err is human, to blame it on the computer is even more human.” 😉
Level 3: Toolchain Trust Issues
From a senior developer’s perspective, this comic is painfully relatable and darkly funny. We’ve all been in debugging hell at some point – especially with a nasty segmentation fault – where in sheer frustration we start questioning every part of the system. The meme exaggerates the blame game to include literally every layer of the development stack. The humor comes from recognition: each panel is a tongue-in-cheek reflection of thoughts developers might have when chasing a bug, each more far-fetched than the last, until it comes full circle. It’s a parody of the internal dialogue (and sometimes external excuses) that happen when a bug’s root cause isn’t immediately obvious.
Consider a typical scenario: your program crashes with a segfault. Initial reaction: “It must be something weird with somebody else’s code, not mine.” (Panel 1, red shirt “Чей-то код” meaning “someone’s code”). Maybe you integrated a third-party library or used a colleague’s module – it’s comforting to think the bug lives there. But then you remember you copy-pasted a snippet from StackOverflow (panel 2, orange shirt) at 2 AM last night to handle that tricky file parsing. Maybe that snippet was flawed or used incorrectly? Indeed, Stack Overflow is a double-edged sword: it’s incredibly helpful (who among us hasn’t grabbed a quick solution from there?), but blindly copying code can introduce bugs you don’t fully understand. It’s almost a rite of passage in programming to realize the code you grabbed off the internet isn’t magic – you have to adapt and test it. When that goes wrong, the knee-jerk reaction is often “Ugh, that snippet from StackOverflow broke everything!”
Next, panel 3 (yellow shirt, “Я” meaning "Me") depicts the developer themselves in the chain. Here the blame is being pointed at the developer personally, only for them to immediately deflect to panel 4 (green shirt, “Мой код” or "My code"). This captures a wry truth: developers often psychologically distance themselves from the code they wrote when it misbehaves. “It’s not me messing up, it’s just my code. Surely I wrote it correctly… maybe the tools messed it up!” That leads us to blame the IDE (panel 5, labeled "IDE"). This might sound odd, but in moments of desperation, you do start wondering, “Did my IDE compile the latest changes properly? Is the debugger lying to me? Is IntelliJ/VsCode/Eclipse doing something strange?” Perhaps the project configuration is wrong, or the build system didn’t rebuild that one file – these things happen, and IDEs occasionally do have glitches. In the blame chain, the IDE says “Don’t look at me; check the static analyzer.”
Enter the static analyzer (panel 6, teal shirt). Static analysis tools (like ESLint, Pylint, SonarQube, or C++’s AddressSanitizer and friends – though ASan is more dynamic, but you get the idea) are supposed to warn us about possible bugs. “Why didn’t the static analyzer catch this?” is a thought an irritated developer might have after the fact. We rely on linters and analyzers to snitch on our mistakes early. If a segfault happened, maybe one thinks, the analyzer should have flagged that null pointer dereference or that out-of-bounds array access! When it doesn’t (perhaps because it’s beyond its analysis capability or wasn’t run at all), the blame moves to the next piece: the tokenizer (panel 7).
Now we’re in seriously facetious territory – only the most paranoid or novice bug-hunter would suspect the lexer (tokenizer) or parser (panel 8) messed up. These are components of the compiler's front-end. But anyone who’s worked with a complex language or a brand-new compiler version might recall a time they thought “Could the compiler be misreading this code?” There have been odd cases, especially with cutting-edge languages or very complex template code in C++, where compilers have bugs. Experienced devs know it’s rare, but we’ve heard the horror stories. So, the tokenizer points to the parser, saying “hey, I just chop up the code; if something’s wrong, it must be the parser’s fault for understanding it wrong.” The parser, in turn, points at the preprocessor (panel 9). In C/C++, the preprocessor is infamous for causing subtle issues (macro expansions can introduce weird behavior). Perhaps the macro replaced something in an unexpected way, or an #ifdef included the wrong code – it’s a real scapegoat in some debugging sessions: “Maybe some macro trickery from the preprocessor is causing this bug.”
The blame continues: the compiler (panel 10, gray shirt) gets fingered by the preprocessor. This is the classic "maybe it’s the compiler’s fault" moment. Old-timers will chuckle here – 99.9% of the time, it’s not the compiler messing up, but that 0.1% looms large in our minds when we just can’t find the bug in our own logic. Modern compilers (GCC, Clang, MSVC, etc.) are incredibly robust, but across decades of programming, most veterans have encountered at least one true compiler bug or optimization quirk that caused headaches. Still, it’s a running joke that when a newbie says “I think I found a compiler bug,” the wise engineer responds, “It’s probably your code.”
The assembler (panel 11, pink shirt) is next in the blame chain, passed the hot potato by the compiler. Honestly, by this point the blame-shifting is purely comedic – developers hardly ever think “the assembler did it!” because the assembler’s job is so mechanical and proven. But in this classroom of excuses, nobody is spared. The assembler passes blame to the linker (panel 12, brown shirt). Now, linkers can be tricky – if you’ve ever had a nightmare with missing symbols or DLL hell, you know the linker isn’t always innocent in general. But a linker error usually shows up immediately when building or when loading the program, not as a random segfault later (unless we get into mismatched binaries and ABI issues – indeed, a messed-up linkage could cause weird runtime behavior if, say, you linked the wrong version of a library and the memory layouts didn’t match. That’s an advanced, sneaky bug class, but certainly possible). So maybe, just maybe, a frustrated dev might utter “Could the linker have linked something incorrectly causing this crash?” It’s desperate, but this comic is all about desperation.
Finally, the operating system (panel 13, cyan shirt) gets blamed by the linker. Now we’ve reached the end of the line – blaming the OS is basically the last refuge of a stumped programmer. It’s equivalent to saying “My code is perfect; the universe around it is wrong.” 😅 In very rare cases, an OS or hardware issue can cause a program to crash (bad drivers, faulty RAM, etc.). But 99% of the time, the OS is just enforcing the rules (like memory protection) and saying “Your program messed up.” And fittingly, in the meme the OS turns around and points that accusing finger right back at “Я” (Me), the developer in yellow. Loop complete! Now the developer has been singled out by the very last entity in the chain. The blame has literally come back to where it probably belonged in the first place.
The cherry on top is the final wide panel: the furious developer hunched over a paper that says “segmentation fault”. That single phrase is both iconic and ominous for developers, especially those working with low-level or unmanaged languages. Seeing “segmentation fault (core dumped)” in your console is almost a rite-of-passage for C/C++ programmers – it often feels cryptic and dire. The developer’s face in the comic says it all: a mix of anger, frustration, and a sour realization that no one else is going to fix this bug. The infinite blame circle has resolved to them. This captures the emotional beat: in the end, no matter how much we curse StackOverflow, our IDE, or even blame gremlins in the compiler, we have to dig in and troubleshoot the issue.
This meme resonates because it humorously externalizes all those fleeting thoughts of blame. In real-life debugging, a senior dev quickly moves past blame to actually diagnose (perhaps using a debugger to check the stack trace or adding logs to pinpoint where things go wrong). But we all recognize that kernel of truth – that moment of “It has to be something else, because I just can’t see what I did wrong!” It’s a shared cathartic laugh: everyone from beginners to seasoned engineers has been there, staring at a cryptic crash, and fantasizing that maybe, just maybe, the fault lies in some obscure layer outside their code. But as the meme deftly illustrates, nine times out of ten, the bug is of our own making. The blame chain coming full circle is basically the universe’s (or the OS’s) way of saying: Nope, it’s on you, the developer.
To see how real this can be, consider a tiny C example that compiles without errors but will produce a segmentation fault at runtime:
#include <stdio.h>
int main() {
int *ptr = NULL; // ptr is a null pointer, points to nothing
*ptr = 42; // BOOM: attempt to write to memory at address 0
printf("All done!\n"); // This line will likely never execute
return 0;
}
The code above passes through all the stages: the parser, compiler, assembler, and linker are totally fine with it – there’s no compile-time error or warning by default (unless you have extra checks enabled). The program will compile into an executable without any fuss. The IDE won’t flag it (unless you have specific static analysis on). Only when you run it does the operating system step in to say “Hold on, you can’t write to address 0!” and throws a segmentation fault. This is a simplistic example of how a bug can evade all those layers of scrutiny until it actually runs. Now imagine a more complex scenario buried in thousands of lines of code – it’s no wonder a frazzled dev starts casting blame wide and far when faced with that "segmentation fault" message and no immediate clue.
The “classroom blame passing” comic format used in the meme is a popular template on developer forums because it visualizes the abstract notion of blame in a very clear, literal way: each student (or item on a list) points to the next, forming a chain. It’s been used in various contexts, but here it’s particularly apt for the compiler toolchain. By labeling each student as a part of the toolchain or ecosystem (StackOverflow, IDE, Compiler, etc.), the meme author made an insider joke: you’d only get it if you know what each of those things are and have experienced a crash journey yourself. Seeing even the tokenizer and assembler in the chain got a chuckle from seasoned programmers – those are such low-level pieces that blaming them is comically absurd in most cases. It’s an exaggeration of the blame-shift tendency, highlighting a bit of our human nature: it’s easier to suspect everything else before admitting our own code (or approach) might be flawed.
In summary, this meme strikes a chord with developers because it encapsulates a universal experience in software development: the “round-robin blame game” during debugging. It’s funny because it’s true (and a little embarrassing): no matter how advanced our tools (from static analysis to compilers), a nasty bug like a segfault can make us momentarily irrational. But at the end of the day, after we’re done pointing fingers in our head, we sigh, roll up our sleeves, and fix that bug – hopefully learning a lesson or two for next time (and maybe writing a unit test to catch it). The comic just lets us laugh at that whole dramatic internal saga from an outside perspective.
Level 4: Infinite Loop of Blame
At the most granular level, this meme exposes a circular dependency of fault in a computing context – essentially an Ouroboros of debugging where every layer of the software stack passes the buck. The final result is a segmentation fault, a crash that occurs when a program tries to access memory that it shouldn’t. From a systems perspective, a segmentation fault is the operating system stepping in to prevent a program from touching memory it doesn’t own – a fundamental safety mechanism in modern OS design. This error originates from the concept of memory segmentation in computer architecture: memory is divided into segments, and accessing an address outside the allowed segment triggers a hardware exception (which the OS catches and labels a "segfault"). In UNIX-like systems, this typically raises a signal like SIGSEGV, abruptly terminating the program. The dreaded nature of a segfault is that it provides almost no high-level insight – it's a low-level fault, meaning something went very wrong with pointers or memory references.
Why couldn’t any earlier stage catch this? In theory, one might hope the compiler or a static analyzer could prevent such a runtime failure. However, deep theoretical limits (hello, Halting Problem and Rice’s Theorem) mean that fully analyzing a program for all possible bad pointer accesses is undecidable in the general case. Static analysis tools attempt approximations (using techniques like abstract interpretation or symbolic execution), but they must strike a balance between false positives and false negatives. Inevitably, some dangerous code slips through. Here, every tool in the chain might technically be doing its job correctly, yet a bug emerges that none of them prevented. This illustrates a classic reality: even a perfectly correct compilation toolchain cannot guarantee a program is free of software bugs or memory errors – some problems only manifest at runtime, especially in languages without automatic memory safety (think C or C++ where raw pointers roam free).
Delving into the compiler pipeline itself, each component has a well-defined theoretical role:
- The tokenizer (lexer) breaks the source code text into a sequence of tokens. It’s often implemented via finite state automata, carefully crafted from the programming language’s lexical rules (regular expressions, essentially). It shouldn’t make mistakes if the language spec and code are correct – but if something odd happened here, the code wouldn’t compile at all.
- The parser then takes those tokens and constructs a parse tree or abstract syntax tree (AST) according to the language’s grammar (a context-free grammar in formal language theory terms). Parsers (using algorithms like LL or LR parsing) will throw errors if the code structure doesn’t conform, but once they succeed, they assume the structure is sound. They won’t catch a logic error like using a null pointer.
- The preprocessor (in languages like C/C++) handles directives (like
#includeand macros) before actual compilation. It’s basically a text substitution system, powerful but blind to semantic meaning. It can introduce subtle bugs via macros, but it won’t know if a macro ultimately causes a bad pointer – it just expands code. - The compiler proper takes the AST and generates lower-level code. This often involves optimization passes, register allocation, etc. While compilers are some of the most vetted software (they have to correctly translate source to machine code), they operate under the assumption that your code is logically correct. They catch syntax and type errors, but a line like
*p = 42;wherephappened to beNULLis perfectly valid C syntax – the compiler will blithely generate machine instructions to do it. (There have been rare compiler bugs in history causing incorrect code generation, but any developer with a few years under their belt treats “maybe it’s a compiler bug” as a last-resort almost never true hypothesis). - The assembler translates assembly language (the human-readable machine instructions the compiler produces) into actual bytes (opcodes). Assemblers operate at an even more mechanical level – they expect the compiler gave them correct instructions. An assembler bug causing a segfault would be extraordinarily bizarre (assemblers have been around since the 1950s; they’re not likely to bungle a simple MOV or ADD today).
- The linker then takes all the compiled pieces (your code, and any libraries) and ties them together into an executable. A linker’s job is to resolve references (which function calls which, where variables are stored, etc.) and lay out the final program in memory. A linkage mistake (like a mismatched function signature or wrong library version) can cause runtime issues or crashes, especially if an incorrect assumption is made about memory layout – but again, linkers are stable workhorses, and most crashes aren’t due to them messing up. They just glue code together.
- Finally, the operating system loads the program into memory and runs it. The OS manages memory pages and will enforce protections (e.g., no writing to memory that isn’t allocated). If your program tries anyway – boom, segmentation fault. The OS is doing exactly what it’s designed for: preventing one program’s mistake from corrupting others or the system. In a way, the OS pointing blame back at the developer is cosmically just: “I just caught your program doing something insane and stopped it – don’t look at me, check your code.”
In a perfect theoretical world, one might imagine a tool that proves a program free of such faults (there is research into formal verification, dependent type systems, etc., that can guarantee certain properties). But in practice, especially when performance and low-level control are priorities, we live with a degree of uncertainty. Each layer in this meme is a guardian of its own narrow realm of responsibility. The lexer guards the lowest lexical sanity, the parser the syntactical sanity, the compiler the translation to machine logic, etc. None of them guarantees semantic correctness in the wild. A segfault is the manifestation of that last line of defense (the OS/hardware) being crossed. It’s a bit poetic: after every automated system green-lit the program, the harsh truth of mathematics and physics (i.e. invalid memory access) delivers the final verdict. And thus, the infinite blame loop begins (and ends) with the human who wrote the code – the one entity not easily modeled or verified by an algorithm.
Description
A multi-panel comic strip, using the 'passing notes in class' meme format, illustrating the journey of a piece of code. The characters are simple stick figures, and the labels are in Russian. The sequence begins with a character labeled 'Чей-то код' (Someone's code) passing a note to 'stackoverflow'. Stack Overflow then passes the note to 'я' (I/me), who relabels it 'Мой код' (My code). This 'My code' is then passed through a long chain of characters representing a software toolchain: 'IDE', 'Статический анализатор' (Static analyzer), 'Токенизатор' (Tokenizer), 'Парсер' (Parser), 'Препроцессор' (Preprocessor), 'Компилятор' (Compiler), 'Ассемблер' (Assembler), 'Линковщик' (Linker), and finally 'Операционная система' (Operating system). The operating system passes a final note back to the 'я' character. The last panel shows the 'я' character looking furiously at this note, which reads 'segmentation fault'. The meme humorously captures the frustrating abstraction of the compilation and execution process, where code copied from the internet goes through dozens of invisible steps, only to fail with a cryptic, low-level memory error, leaving the developer with the daunting task of debugging
Comments
7Comment deleted
A segmentation fault is the compiler's way of saying it has successfully passed the bug from its jurisdiction to the operating system's, which has now made it your problem again
Segfault debugging is the purest supply-chain audit: tokenizer, compiler, linker, even the kernel all sign off “not it,” and the only artifact that makes the round-trip is your undefined behaviour
After 20 years in this industry, I've learned that the build pipeline is just an elaborate game of telephone where everyone correctly repeats what they heard, but nobody bothered to check if the original message was "Hello World" or a null pointer wearing a trench coat
After your code survives the gauntlet of static analysis, tokenization, parsing, preprocessing, compilation, assembly, and linking - each layer dutifully passing it along like a game of telephone through the entire toolchain - the OS finally delivers the punchline: segmentation fault. It's the universe's way of reminding you that all those intermediate representations were just elaborate foreplay before the inevitable core dump. At least you can tell the PM it compiled successfully
Bubble sort on prod dataset: the 'kaboom' testing your incident response before the swaps even finish
In the toolchain blame graph, everything is deterministic until the kernel returns SIGSEGV - turns out StackOverflow isn’t a memory manager
The C toolchain is great at distributed consensus - for blame: tokenizer, parser, compiler, linker all LGTM, and the OS enforces it with SIGSEGV