Skip to content
DevMeme
2722 of 7435
The Terrifying Gauntlet of Hitting 'Continue'
Debugging Troubleshooting Post #3007, on Apr 23, 2021 in TG

The Terrifying Gauntlet of Hitting 'Continue'

Why is this Debugging Troubleshooting meme funny?

Level 1: Too Many Stops

Imagine you’re reading a storybook, and after every sentence someone makes you stop and discuss it. You read one line – stop. You read the next line – stop again. It would take forever to get through the story, right? That’s what’s happening in this meme, but with computer code. The developer’s program keeps stopping because they put too many pause points (called breakpoints) in the code. Pressing the “run and continue” button is like trying to keep reading the story, but because there are so many pauses set up, the program just stops over and over, almost immediately each time.

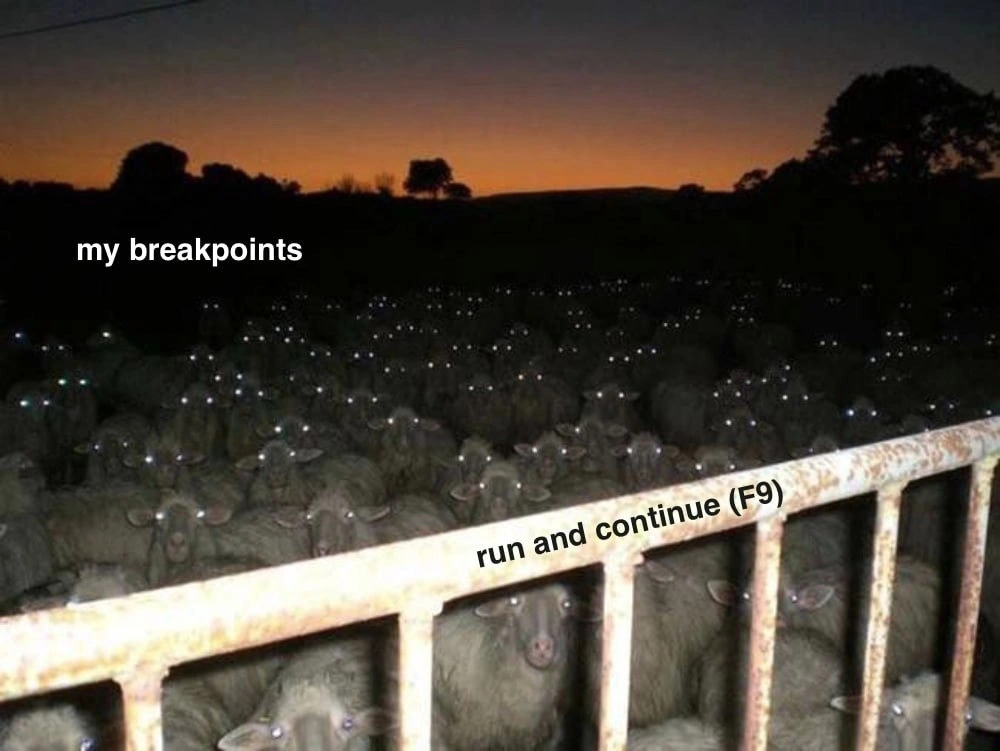
The funny picture with the sheep helps tell this story. Think of the sheep as those pause points (breakpoints). There are a ton of them crowded together, all waiting. The gate in front is like the “continue” button that lets the program run. When the gate opens (when the developer presses continue), you’d expect maybe one or two sheep to come out and then things calm down. But here, there are so many sheep that if you open that gate even a little, they all want to rush out one after another. It’s overwhelming! In other words, the programmer set so many breakpoints that every time they try to run the program, it immediately stops because another breakpoint “jumps out.”

So in very simple terms: the developer wanted to check their work using breakpoints (pauses in the program), but they went overboard and set way too many. Now the program can’t run normally without constantly stopping. It’s a silly, exaggerated example showing how a helpful tool can become a hurdle if you use it too much. And it makes us laugh because we can imagine the developer’s face: “Oh no, not another stop... how many did I put in there?!” It’s the programming equivalent of putting a stop sign on every corner of your street – you’d never get anywhere!

Level 2: Breakpoints Everywhere

Let’s break down what’s happening in simpler terms. A breakpoint is a debugging tool – basically a marker you set on a line of code to tell the debugger, “Pause here when you get to this line.” When you run your program in a debugger (which many IDEs like Visual Studio, VS Code, or IntelliJ provide), the program will stop at each breakpoint and let you inspect what’s going on (check variable values, step through code line by line, etc.). It’s like putting a bookmark in a story, but one that actually makes the story stop so you can take a closer look at that page. Super useful for DebuggingAndTroubleshooting!

Now, why would there be so many breakpoints? Imagine you’re trying to find a tricky bug. You aren’t sure where things go wrong, so you sprinkle breakpoints all over the place – at the start of functions, inside loops, before and after certain calculations. Each one is a little stop sign for your code. It’s easy to lose count of how many you set, especially if you’re deep in concentration or a bit frustrated. This leads to what we call breakpoint overload – having a ton of active breakpoints at once. In our meme, all those sheep crowded in the field represent the developer’s many breakpoints. Their glowing eyes in the dark are a funny exaggeration of how breakpoints might feel if they were visible entities in your program. (In reality, an IDE might show breakpoints as red dots in the margin of your code, not glowing eyes – but you get the idea!)

Now, about the caption on the gate: “run and continue (F9).” In debugging, Continue (often bound to a key like F5 or F9, depending on the IDE) means “resume the program’s execution until the next breakpoint (or until the program ends if there are no more breakpoints).” So if you’ve paused at a breakpoint and you hit the Continue command, the program should carry on running. But here’s the catch: if there is another breakpoint immediately ahead, the program will pause again right away at that one. That’s exactly the situation the meme is portraying. The developer pressed Continue (F9) expecting the program to maybe run to completion or at least go farther, but surprise! – there was another breakpoint almost immediately. And another... and another. Each time they press F9, the program moves forward a tiny bit then hits the next breakpoint, halting again. It’s as if those breakpoints are lined up one after the other, completely overwhelming the normal flow.

This is a relatable developer experience for many of us. A common scenario: say you accidentally left a breakpoint inside a loop that runs 100 times. When you continue, the program will stop on that breakpoint every single iteration of the loop. You’d have to hit Continue 100 times to get past it! Or maybe you set breakpoints in ten different functions while hunting a bug. Later, you forgot some of them were still active. So you run your code under the debugger, and it stops at Function1’s breakpoint. “Oh right,” you think, and press Continue. Then it immediately stops at Function2’s breakpoint... “Ugh, forgot that one too.” Continue... stop at Function3... and so on. It becomes a cascade of pauses. This feels both frustrating and a bit comical – you almost start laughing at how you’ve booby-trapped your own program.

The meme uses the sheep and gate metaphor to make this scenario vivid. The gate with F9 is like the Continue button that’s holding back all those stops. The moment it opens (you press it), boom – a breakpoint triggers (a sheep tries to get out). You close the gate and open again (press F9 again), and another breakpoint triggers (next sheep!). It’s a flood of interruptions. In real life, a developer in this situation might smack their forehead and then go to the IDE’s breakpoint panel to disable or remove a bunch of breakpoints all at once. (Yes, IDEs typically have a panel listing all your breakpoints, precisely because it’s easy to forget where you set them. You can turn them off globally with a single click if needed – effectively telling the debugger to ignore all breakpoints for now.)

In summary, this meme is highlighting a common DebuggingPain: you overused a helpful feature (breakpoints) and ended up stuck. It’s funny because it’s true – even though breakpoints are meant to help you control execution, having too many feels like you’ve lost control completely. And just about every programmer has had that “why won’t it just run?!” moment before realizing “Oops, I left a breakpoint (or twenty) in there.” It’s an easy mistake and a rite of passage in learning to debug effectively.

Level 3: Breakpoint Stampede

Picture the scene: a dark codebase at midnight, hundreds of breakpoints lurking like glowing eyes in the darkness. In the meme image, “my breakpoints” hovers over a dense flock of sheep whose eyes shine back eerily, while a rusty gate labeled “run and continue (F9)” holds them at bay. This is a tongue-in-cheek take on DebuggingFrustration in an IDE. Every experienced developer knows this feeling: you’ve peppered your code with so many breakpoints while chasing a bug that continuing execution is like opening the floodgates to a stampede. Pressing Continue (F9) is supposed to let your program run freely, but instead it’s unleashing an army of paused states – breakpoints triggering one after another in rapid succession.

In a real debugging session, this happens when you set an excessive number of breakpoints (often out of desperation). Each glowing sheep eye in that pasture is a breakpoint marker waiting to halt your program. The gate labeled F9 – the Run/Continue command – is the only thing holding back chaos. The humor comes from exaggeration: nobody expects to have hundreds of active breakpoints, but it feels that way when you’ve lost track of them. Seasoned devs nod knowingly here. We’ve all had that “oh no…” moment after hitting run: the app freezes immediately on a breakpoint you forgot about. You hit F9 to resume, and bam – another breakpoint. F9, bam – yet another. It’s a rapid-fire gauntlet of stops, like a herd of sheep rushing through as soon as the gate cracks open.

What makes this meme really relatable is the DeveloperExperience behind it. In modern IDEs (Visual Studio, IntelliJ, PyCharm, etc.), breakpoints are incredibly useful for troubleshooting. But mismanage them, and your debugging session turns into a comical nightmare. The meme captures a common anti-pattern: using too many breakpoints (a breakpoint_overload) without disabling them when done. The result? Your debugger becomes almost unusable. It’s darkly funny because we’ve been there – late at night, eyes bleary, confronted with a wall of breakpoint hits. The glowing eyes of the sheep perfectly symbolize those breakpoints “staring” back at you, as if each one is saying, “Gotcha! Stop here.” The fence labeled F9 is a clever detail: it’s the thin rusty barrier between you and madness, the Continue key you keep slamming hoping to outrun the breakpoints.

Behind the humor lies a bit of wisdom from veteran developers. We learn to manage breakpoints: set a few strategic ones, use conditional breakpoints when needed, and disable or remove them after use. There’s even a feature in many debuggers to “Disable All Breakpoints” – essentially a panic button when you realize you’ve set an absurd amount. Why? Because hitting Continue 50 times in a row is nobody’s idea of fun. :sweat_smile: The meme exaggerates it (hundreds of sheep-like breakpoints) to drive the joke home. It’s a classic piece of DeveloperHumor that plays on our shared pain. After all, nothing unites programmers quite like the absurdity of a late-night debugging mishap – be it an infinite loop of log spam or an unexpected breakpoint stampede. Here we’re laughing at the latter, with a knowing shake of the head and maybe a promise to ourselves to clean up our breakpoints next time.

Description

This meme uses a dimly lit, slightly unsettling photograph of a massive flock of sheep packed together in a field at dusk. Their eyes are all reflecting light, appearing as dozens of glowing white dots in the darkness, staring forward. In the foreground, a rusty metal gate pens them in. The humor is conveyed through overlaid white text. The vast sea of sheep with glowing eyes is labeled 'my breakpoints'. The gate in the foreground is labeled 'run and continue (F9)'. The joke is a visual metaphor for the software debugging process. The numerous, watchful sheep represent the many breakpoints a developer has scattered throughout their code to catch a bug. The 'run and continue' command (often mapped to the F9 key in IDEs) is the action that lets the program's execution proceed, only to be inevitably stopped by the next lurking breakpoint. The eerie atmosphere of the image humorously captures the feeling of navigating a complex, bug-ridden codebase, where every step forward is watched and halted by a sea of potential issues

Comments

9
Anonymous ★ Top Pick I'm not saying I use too many breakpoints, but when I press F9, my IDE asks if I want to 'release the horde' and my CPU fan starts playing boss music
  1. Anonymous ★ Top Pick

    I'm not saying I use too many breakpoints, but when I press F9, my IDE asks if I want to 'release the horde' and my CPU fan starts playing boss music

  2. Anonymous

    Hit F9 and every forgotten breakpoint across fifteen microservices lights up like ZooKeeper watch events after a partition - suddenly I’m herding sheep instead of shipping code

  3. Anonymous

    After 15 years in the industry, you realize the real horror isn't the production bug at 3am - it's opening last week's debugging session and finding 47 conditional breakpoints you set while chasing a race condition that turned out to be a timezone issue in the logging framework

  4. Anonymous

    When you set 'just one quick breakpoint' to debug a responsive layout issue at 2 AM, but now you're staring at 47 breakpoints across 12 files, each one looking back at you with those glowing eyes, silently judging your life choices. The F9 key becomes your only friend - or your worst enemy - as you frantically try to remember which breakpoint was actually relevant. Spoiler: it was the one you removed three iterations ago

  5. Anonymous

    When your system only behaves with a debugger attached, breakpoints stop being a tool and start being semaphores - F9 is release(); congrats on accidentally implementing flow control with your IDE

  6. Anonymous

    Resuming a microservices debug is poor man’s distributed tracing - every stray breakpoint lights up a service I forgot to mock

  7. Anonymous

    20+ YoE wisdom: breakpoints everywhere catches the bug in prod logs you forgot to check

  8. @sashakity 5y

    lmao

  9. @wizaral 5y

    hard. please describe

Use J and K for navigation