Embracing the Post-Deployment Chaos
Why is this OnCall ProductionIssues meme funny?
Level 1: Laughing to Keep from Crying
Imagine you’re working on a big school project – say, a volcano science experiment. You’ve spent all day carefully building it. Finally, it’s the moment of truth: you add the final ingredient to make it erupt for a cool effect in front of the class. But instead of a little bubbly lava trickle, BOOM! The volcano overflows like crazy, spewing foam everywhere, knocking over other projects, and setting off the fire alarm. The classroom is in chaos, there’s mess and smoke (let’s pretend it’s a really wild volcano!), and everyone’s looking at you. How would you feel? Probably scared and shocked! But you might also start giggling like “oh no, what have I done… this is so ridiculously bad it’s almost funny.” You’re not happy the project failed – you’re laughing because it’s such a big disaster that you don’t even know how to react. That’s what this meme is about. The person did something (they deployed new code) thinking it would be great, and everything caught on fire instead (not literally fire, but the whole system broke). And there they are, standing in front of the disaster they accidentally made, with a big stunned smile. It’s the kind of laugh you do when things went really wrong but all you can do is say, “Whoops!” and try to fix it. Sometimes things go so wrong that you just have to laugh a little, or else you’ll cry – and laughing helps you stay calm enough to handle the mess.
Level 2: When Deploys Attack
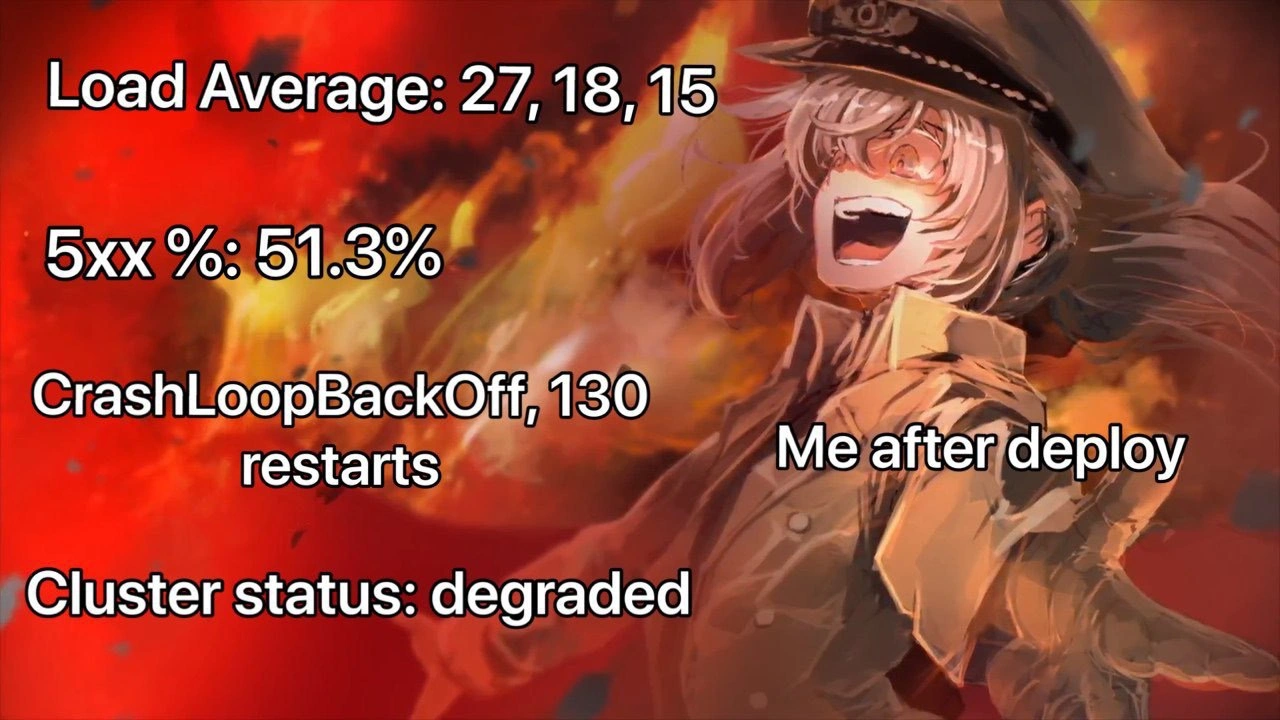
Let’s dial it back a bit and explain what’s going on here in simpler terms. You push a new version of your app to production (that’s the deploy), and suddenly everything goes wrong at once. It’s the ultimate DeploymentFailure scenario – the kind that gives junior developers nightmares and makes senior devs stock up on extra coffee for their OnCallDuty rotation. The meme shows a character grinning in front of raging flames with text readouts of system metrics. Those metrics are basically the system’s way of telling us “I’m dying over here!” Here’s what each of those scary numbers or messages means in real life:
Load Average: 27, 18, 15 – These numbers come from Linux/Unix systems and indicate how busy the server’s CPU is over 1, 5, and 15 minutes. For example, if you have a 4-core server, a load average of 4.00 means all cores are fully utilized. A load of 27.00 is astronomically high – imagine 27 people trying to use 4 seats at the same time. The server CPU has a huge traffic jam of processes. The fact it’s
27, 18, 15means it’s been very high for the last 1 minute (27), and still high on average over 5 min (18) and 15 min (15). This is a big red flag: your new code likely provoked a ton of extra work (maybe an infinite loop or heavy computation), and now the poor machine is overwhelmed. It’s working harder than it possibly can, so everything slows to a crawl.5xx %: 51.3% – The term 5xx refers to HTTP 500-series error codes, which generally mean “the server messed up.” When you see something like 51.3% 5xx, it’s saying over half of all requests are resulting in server errors. In other words, more than 1 in 2 people trying to use the app are hitting a failure! 😬 A 5xx error could be a 500 Internal Server Error, a 503 Service Unavailable, etc. The key point: a huge chunk of users are getting nothing but error pages. This usually happens when the server code is crashing or the service behind it is down. So, 51.3% errors means your deploy broke at least half of the app’s functionality. If this were an online store, half the customers now can’t buy anything – definitely a ProductionIncident to wake the team up.
CrashLoopBackOff, 130 restarts – This message is specific to Kubernetes, the popular container orchestration platform (which manages how application containers are run across a cluster of machines). CrashLoopBackOff is basically Kubernetes saying: “Hey, I tried to run your app, but it keeps crashing immediately. I’m going to keep restarting it, with some delays (back-off), but it’s failing over and over.” The
130 restartspart means it has already attempted to restart that app 130 times! Think about that – the app crashes, Kubernetes restarts it, it crashes again, repeat… 130 times. That indicates something is fundamentally wrong with the new version you deployed: maybe a bad configuration (like the app can’t connect to the database and so it exits every time), or a bug that causes a fatal error on launch. Kubernetes won’t give up easily – it tries to heal problems by restarting crashed services – but here it’s stuck in a loop. This is why the meme references a CrashLoopBackOff: it’s a classic Kubernetes way to say “this thing is repeatedly failing and I’m in a back-off retry mode.” For anyone who’s seen it during a deploy, it’s a sinking feeling: your new code never truly started successfully even once; it’s just crash -> restart -> crash endlessly.Cluster status: degraded – Imagine you have a whole fleet of servers (that’s your cluster). A healthy cluster means all your services are running fine across those machines. Degraded means the cluster is not fully healthy – something’s wrong but it’s not completely down. Perhaps some servers in the cluster have failed or some services are not functioning correctly. It’s like your car running with a flat tire: it still moves, but not well. In a cloud or Kubernetes context, “degraded” might mean user requests are still coming through, but maybe with higher latency, or only part of your system is working (for example, maybe one data center is down but others are up). It’s essentially partial outage mode. In the meme’s scenario, the deploy caused enough havoc that the orchestrator said “uhh, guys, we have a problem”. The cluster might be automatically trying to recover – maybe spinning up new instances, rescheduling pods, etc. – but until things stabilize, it’s marked as degraded in status dashboards. This tells on-call engineers that they’re in a non-normal state and need to fix something ASAP.
Now, picture all of these happening together right after a deployment. Post deploy chaos is an all-too-real phenomenon: you push new code live, and within moments your monitoring tools are sending frantic alerts. CPU usage spikes (that’s the load average shooting up), error rates explode (all those 5xx errors), and some of the new containers crash immediately and repeatedly (hello CrashLoopBackOff) causing a cascading failure. The observability and monitoring systems we set up – logs, metrics, dashboards, alerting – are basically lighting up bright red to let us know we’ve unleashed a monster into production. It’s often described as “the dashboard Christmas tree” effect: everything goes red or orange, like blinking lights, but it’s no holiday – it’s an emergency.
For a junior developer or someone new to DevOps/SRE, this situation is the stuff of anxiety. It’s the reason many teams do things like canary releases (deploying to a small percentage of servers first) or have robust rollback procedures. A newbie might double-check “Did I run all the tests? It worked on my machine, why is it blowing up in production?” The truth is, there are things that only show up under real workloads or specific environment conditions. Maybe the new code ran fine on your laptop (which had 1 user – you) but in production, with thousands of users, it craps out. Or maybe it needed a setting that was present in staging but missing in production, causing those crashes. Containerization (like using Docker containers in Kubernetes) makes deployments consistent in theory, but you can still misconfigure stuff like environment variables, resource limits, or dependency versions, leading to these failures.
The meme’s humor comes from the contrast between the severity of the situation and the developer’s reaction. Instead of panicking, the character is standing there grinning like an anime villain overseeing the destruction. Realistically, an engineer would be scrambling to rollback the deploy or patch the issue – but there’s a moment of “wow, that escalated quickly” that can bring out a crazed smile. It’s a form of shock or coping. If you’ve ever been in a high-severity incident call (the kind at 2 AM, where half the company is in a Zoom war room trying to fix production), there’s always a bit of nervous laughter and gallows humor floating around. Someone might say, “Welp, that deploy really set the cluster on fire, didn’t it?” and everyone grimly chuckles while working furiously to fix it. You laugh not because it’s actually funny that users are getting errors, but because if you don’t find some humor, you might just cry or freeze up. It’s a human response to stress.
For those new to this: yes, deploying to production can sometimes be chaotic. But teams prepare for this with good practices: automated rollbacks, feature flags (so you can turn off the bad code quickly), staging environments, load testing, and so on. Still, occasionally something slips through, and you get the kind of scenario shown in the meme – the kind where you learn a very valuable lesson (and maybe write a very long post-mortem document after). The key takeaway is: all those metrics (load average, error rate, restarts, status) are crucial signals. They’re the smoke detectors of software. In this case, they didn’t just detect smoke – they found a five-alarm fire.
And the person in the meme? The text “Me after deploy” implies that’s the developer who pushed the release, now watching everything burn. The background is literal flames, which is exactly what “fire_fighting in production” feels like (we even call fixing urgent issues “firefighting”). The character’s wide grin and crazy eyes – that’s the mix of “uh oh” and adrenaline that hits. It’s like when you pull a prank and it goes way bigger than expected – you’re a bit proud of the chaos but also petrified. In the world of IT, we use terms like “dumpster fire” or say “the server is on fire” metaphorically when things are going horribly wrong. This meme just visualizes it quite literally.
So, to a junior dev or someone not deeply familiar with these terms: the meme is showing a worst-case ProductionOutage scenario caused immediately by a bad deploy. The humor (and horror) is that the developer is just standing there grinning at the epic disaster they unintentionally caused. It’s funny in the same way a cartoon might show a character blowing something up and then sheepishly smiling at the camera. It resonates with anyone who’s experienced a deployment that went beyond bad. After you’ve been through a couple of these, you start to recognize that hysterical grin as a shared inside joke among engineers — “Yep, been there, buddy. Good luck.”
Level 3: CrashLoop & Burn
In the fiery aftermath of a Deployment gone wrong, every metric on your Observability & Monitoring dashboard is screaming mayday. Seasoned engineers know this tableau all too well: new code hits production and suddenly the cluster’s load average is off the charts, error rates are spiking, pods are restarting like they’re stuck in a Groundhog Day reboot cycle, and the whole Kubernetes cluster is marked degraded (which feels like the understatement of the year when everything is actively on fire). The meme’s exaggerated flames and manic grin capture that exact SRE nightmare: your code release has basically turned into a denial-of-service attack on your own infrastructure, and you’re left smiling in shell-shocked disbelief.
Let’s break down the chaos: Load Average: 27, 18, 15 means the CPU load on the server (or across the cluster nodes) is absurdly high. On a typical 4-core machine, a load average of 4.00 means all CPUs are fully busy – so 27.00 means the system is doing the work of roughly 27 CPUs at once, or rather trying to. It’s a sign that threads are piling up waiting for CPU time. In practice, a load average in the high twenties is red-alert territory: the server is essentially melting down under far more work than it can handle. Often this happens when a newly deployed service has an inadvertent infinite loop or a monstrous query that sends CPU usage spiraling. Translation: your code change turned the server into a panicked traffic cop, waving far more processes through than it can direct, causing a huge jam.
Next, that 5xx %: 51.3% on the dashboard – over half of all requests are erroring out with HTTP 5xx status codes. HTTP 5xx errors (like 500 Internal Server Error, 503 Service Unavailable, etc.) mean the server blew up while trying to process a request. A 51.3% error rate is catastrophic: more than half the users (or microservice calls) are getting back “Something went wrong” responses. This often happens when your freshly deployed service can’t handle the load or crashes on certain inputs – maybe a misconfigured database connection causing frequent exceptions or a new bug throwing errors for every other request. The system is basically flipping a coin on whether to serve a page or show an error. It’s the production equivalent of a coin toss where “heads” means it works, and “tails” means the app crashed. Not exactly the reliability we aim for.
And then we have the dreaded CrashLoopBackOff, 130 restarts. This is pure Kubernetes SRE horror: it indicates one (or many) of your pods is stuck in a start-crash-restart loop. CrashLoopBackOff is Kubernetes-speak for “I keep restarting your container, but it keeps dying immediately, so I’m gonna back off and try again, over and over”. Seeing 130 restarts means Kubernetes has attempted to relaunch that failing service 130 times (!) and it’s still not staying up. The cluster is valiantly trying to self-heal and your code is basically saying “nope!” each time. This usually stems from something like an uncaught exception in the app’s startup, a missing config that causes a fatal error on launch, or a dependency that isn’t available. For instance, if the new version of the app can’t connect to Redis on startup due to a bad config, it will crash, Kubernetes restarts it, and it crashes again – ad infinitum. Kubernetes will exponentially increase the delay (the “BackOff”) between retries, but by attempt 130 you know this pod is a lost cause. It’s the container equivalent of “What’s the definition of insanity? Doing the same thing over and over expecting different results.” Meanwhile, other services depending on this one are now failing too, which could be feeding into that 51% error rate.
Finally, Cluster status: degraded is the polite way of saying “the cluster is really unhappy right now.” In a multi-node setup, degraded usually means some nodes or services are not functioning properly, but the cluster hasn’t completely given up the ghost yet. Perhaps only half your pods are alive, or the cluster’s internal etcd database is under strain, or your ingress is partially failing. It’s that sickly yellow status between green (healthy) and red (down) on your status dashboard. When the cluster is degraded, you might still be serving some traffic, but capacity or reliability is severely compromised. A degraded cluster often occurs during cascading failures: one service going haywire can bog down others, consume all the resources, or knock out a critical component that orchestrates the system. It’s like a chain reaction: your one bad deploy creates high load, which drags down node performance, which in turn might cause heartbeats to fail or autoscalers to misbehave, and soon enough multiple parts of the system start faltering in unison. The cluster’s basically holding on by a thread.
So why on earth is the engineer in the meme grinning like a maniac instead of crying under the desk? This is a flavor of dark humor almost every seasoned DevOps/SRE person develops as a coping mechanism. When you’re on On-Call Duty and a routine deploy suddenly sets the cluster ablaze, there’s that surreal moment of “is this really happening?” Often, it’s so absurd or terrifying that you get a burst of hysterical laughter or a big adrenaline-fueled grin. Part of you is thinking, “Wow, I really did it this time – I broke Production in style!” 😅. Another part of you knows that panicking won’t help, so you enter this almost zen-like acceptance of chaos. It’s a “yup, everything’s on fire, noted” mindset that paradoxically can look like calm.
There’s also an element of shared absurdity here that only fellow engineers truly appreciate. We’ve all been there: you deploy what you think is a minor change on a Friday afternoon (DeploymentFailures always love Fridays), and within minutes your ProductionIncidents pager is buzzing non-stop, Slack is blowing up, and all your graphs turn red. Instead of the new feature delighting users, you’re watching the Production Outage unfold in real time. In that moment, after the initial oh $#!% feeling, sometimes you just have to chuckle at how quickly things went south. It’s either laugh or cry, and you already used up your tears the last time an OnCall shift did this to you. That crazed grin says, “Welp, here we go again – time to wrestle the fire-breathing deployment dragon.”
The manga/anime-style character in uniform with arms outstretched amidst the inferno perfectly embodies the inner drama. It’s like the deploy has turned the engineer into a war general standing atop a battlefield of flaming servers. A cluster_degraded alert might as well be a siren in the night, and our intrepid (if slightly delirious) hero is facing it head on. The humor comes from this SREHumor contrast: deployments are supposed to be orderly, routine, even boring with all our modern CI/CD pipelines – yet here we are with a full-blown post_deploy_chaos scenario, and the engineer is shown almost enjoying the spectacle. Of course, in reality they’re not happy the system is crashing; that grin is the face of someone embracing the chaos because they have no other choice. It’s a mix of “I can’t believe this is happening” and “Challenge accepted – let’s fix this.”
Under the hood, this meme also pokes at the unpredictable nature of complex systems. Modern production environments (especially with microservices and containers everywhere) are like a stack of tinder: one small spark from a bad deploy can ignite a massive blaze. You might have all the right processes, tests, and monitoring, yet still an issue slips through that cascades into a firestorm. Senior engineers recognize that ProductionIncidents of this magnitude are both horrifying and strangely educational – every disaster is a post-mortem waiting to happen, teaching us how not to burn down the cluster next time. The veteran humor in “still grinning” acknowledges that sometimes you don’t immediately know whether to be terrified or impressed at the magnitude of the failure. We joke that “we meant to do some chaos engineering to test our system’s resilience – just didn’t expect to be doing it right now, in production, unintentionally.” The sight of those numbers (load 27, 51% errors, 130 restarts…) is so over-the-top that it loops back around from tragedy to comedy.
In sum, this top level of the meme analysis revels in the technical absurdity: it’s painting the picture of a veteran engineer deploying code and instantly facing a production apocalypse. The combination of load_average_spike, skyrocketing 5xx errors, mass kubernetes_crashloopbackoff events, and a cluster_degraded status is basically a perfect storm. And the punchline is the engineer’s reaction – that hysterical grin – which signals a kind of battle-hardened acceptance. It’s the laugh of someone who’s stepped in the same hole before and will probably step in it again, because in the world of DevOps/SRE, when it rains, it pours… and sometimes it pours gasoline on your cluster and tosses a match for good measure.
Description
The meme features Tanya von Degurechaff from the anime 'The Saga of Tanya the Evil', laughing maniacally with a wide, joyous expression against a backdrop of intense orange and red flames. Overlaid on this chaotic scene are several lines of white text, indicating critical system failure metrics. From top to bottom, the text reads: 'Load Average: 27, 18, 15', '5xx %: 51.3%', 'CrashLoopBackOff, 130 restarts', and 'Cluster status: degraded'. Another text overlay near the character says 'Me after deploy'. This meme captures the dark humor of a catastrophic deployment. The metrics are all indicators of a system under extreme stress: a very high load average signifies overwhelmed CPUs, a 51.3% 5xx error rate means over half of server requests are failing, 'CrashLoopBackOff' is a well-known Kubernetes state for a repeatedly crashing application, and a degraded cluster status confirms the system is unhealthy. The humor lies in the engineer's seemingly joyful, unhinged reaction to the production disaster they've just caused, a feeling of detached amusement that can sometimes follow a massive failure

Comments
7Comment deleted
That's not a degraded cluster, that's a successful chaos engineering experiment. The report will show the system's high availability for displaying 503s
Sure, the load average is 27, but look on the bright side - our error budget is finally getting some exercise
The beautiful thing about CrashLoopBackOff is that it gives you 130 chances to watch your init container fail in slightly different ways while you slowly realize the ConfigMap you deployed is pointing to the wrong AWS region
Ah yes, the classic post-deployment experience: watching your load average climb into the stratosphere while your pods enter an infinite CrashLoopBackOff death spiral, achieving that coveted 51.3% error rate that really shows you've mastered the art of distributed systems failure. At this point, you're not debugging - you're conducting a post-mortem on a system that's still technically alive. The real question isn't 'what went wrong?' but rather 'which of the 47 microservices we deployed simultaneously decided to take down the entire cluster?' Pro tip: when your monitoring dashboard looks like this, it's not a deployment - it's a cry for help wrapped in YAML
Deployed the 'hotfix' - now CrashLoopBackOff is our cluster's favorite dance, looping 130 times to the tune of 27 load avg
The canary died, the HPA started crossfit, and by T+2 minutes our SLO was a memory - CrashLoopBackOff is the only thing consistently up
Nothing says “mature release process” like burning the quarter’s error budget in 30 seconds while the HPA thrashes pods into CrashLoopBackOff and rollback races PagerDuty’s ringtone