The Senior Developer's Most Trusted Debugging Tool
Why is this Debugging Troubleshooting meme funny?
Level 1: Pausing Time vs. Leaving Clues
Imagine you’re trying to solve a mystery in a storybook. You have two ways to figure out what’s going on:
Pausing the Story: You have a magic remote that lets you freeze the story at any moment. You can look around at all the characters, see what they’re holding, what they’re saying, and you don’t let the story continue until you’re ready. This is like using a debugger in coding – you pause the program and check everything in that exact moment. It’s super handy because you get to see the whole picture right when something looks suspicious.
Leaving Clues and Reading Them Later: You don’t pause the story at all. Instead, as the story goes on, you slip little notes or bookmarks on important pages. Maybe you underline a clue here, jot a margin note there. When the story ends (or when things go wrong), you go back and read all those notes to understand what happened. This is like using print statements for debugging – you let the program run normally, but you print out messages (clues) at certain points. After it runs, you read those messages to piece together the mystery.
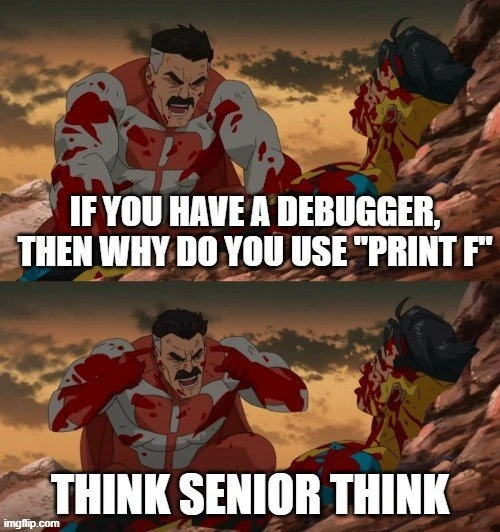
Now, the meme is funny because it’s basically someone shouting, “You have a magic remote that can PAUSE time, so why on earth are you just leaving yourself notes?!”. The scene shows a very strong, frustrated superhero yelling at someone injured – it’s a dramatic way to say, “Come on, think! Use the easier method if you have it!”. In real life, that means if a programmer has a special tool to pause and check their code, they should use it, instead of doing it the harder way with a bunch of printed notes. It’s exaggerated and silly (nobody actually gets beat up over using printf!), and that’s why it’s humorous. Even kids can get the basic idea: it’s frustrating to watch someone not use a helpful tool. The meme just shows that feeling in a big, cartoonish way.
Level 2: Bugs, Breakpoints, and Printfs
Let’s break down the meme’s ingredients in simpler terms. It’s referencing two common ways to debug (find and fix errors in code): using a debugger or using print statements.
A debugger is a special tool (often built into your IDE or as a command-line like
gdb) that lets you run your program step by step. You can set breakpoints, which are like little red stop signs on a line of code. When the program runs and hits a breakpoint, it pauses right there. While paused, you can peek at variables, see the call stack (the chain of function calls that got you there), and even change values on the fly. It’s like having a remote control for your code’s execution. For example, in Visual Studio or IntelliJ, you might click next to a line number to insert a breakpoint, run the program in debug mode, and then inspect everything when it stops. This is super powerful because you get to interact with a live program without modifying the code just to see what’s going on.Print statement debugging (aka print_debugging) is a more manual technique. You add lines in your code to output (print) the values of certain variables or the flow of execution to the console or log file. A classic example in C would be adding
printf("value of x = %d\n", x);at suspicious spots in the code, then re-running to see those outputs. In Python you might doprint(f"got to step 2, x={x}"), or in JavaScriptconsole.log("x", x). These prints act like breadcrumbs, leaving a trail in the program’s output so when it finishes (or crashes), you can trace back what happened from the messages. It doesn’t pause the program; it just records information while running normally.
Now, why would a senior developer (meaning someone with a lot of experience, who’s presumably seen many bugs before) use print statements when they “have a debugger”? That’s the crux of the meme. It’s highlighting a kind of old-school vs new-school mindset:
Old-School (Prints): Many veteran devs started out when using a debugger wasn’t always easy or even possible. They got very good at reading log output and figuring out problems just from that. This is sometimes called printf debugging or poor man’s debugging. It’s straightforward: you don’t need fancy tools, just your code and maybe a console. Even today, some devs prefer this because it works almost everywhere (you can even do it in systems where you can’t run an interactive debugger, like a remote server or when debugging an initialization sequence where attaching a debugger is tricky). It’s also deterministic – the program isn’t being paused or altered by the act of debugging, so you see exactly what it would normally do (plus some extra prints).
New-School (Debugger): Modern development environments (like VS Code, Eclipse, Xcode) make debugging a breeze. You hit F5 or click “Debug”, and you can step through code line by line. It’s often faster to pinpoint an issue because you can inspect anything in the moment. For example, instead of adding 10 print statements around a suspicious function, you can set one breakpoint and, when the program stops there, check all the local variables, test different branches by stepping into or over functions, etc. It’s interactive and exploratory. A lot of educators encourage new programmers to learn to use the debugger early, as it can save them hours of frustration.
The meme’s text “IF YOU HAVE A DEBUGGER, THEN WHY DO YOU USE PRINT F” is basically someone yelling: “You have this great tool, why are you doing it the hard way?!” The second line “THINK SENIOR THINK” implies “Use your brain, experienced dev – you of all people should know better!”. This all is overlaid on the Invincible “Think, Mark, Think” scene – a now-famous template where a character (Omni-Man) angrily lectures his son (Mark). In our meme, Omni-Man’s rage is re-contextualized as the frustration of one developer towards another. They even replaced “Mark” with “Senior” to target those seasoned coders. It’s a form of CodingHumor that resonates because many in tech have either met that stubborn senior who won’t use the debugger, or they are that senior and have been on the receiving end of such teasing!
This falls under Debugging_Troubleshooting in developer humor because it’s literally about troubleshooting code and the (sometimes absurd) ways we go about it. It’s also about DeveloperExperience_DX: using a debugger vs. prints can drastically change your experience of hunting a bug. A smooth debugging session can make you feel like a code wizard, while scattered print statements can feel like deciphering the Matrix output. Yet, despite the superior developer tools available, old habits die hard – which is exactly why this meme exists. It’s gently poking those who have decades of experience (senior devs) to maybe re-evaluate their go-to debugging method. And for younger devs or those new to the field, it’s a wink at a truth you might not expect: even the “pros” sometimes default to simple methods.
In summary, this meme is illustrating the debugger_vs_printf debate in a humorous, exaggerated way. It uses an iconic meme format (angry superhero dad scolding) to capture the DebuggingFrustration we feel when someone isn’t using the tools we believe they should. It’s both a joke and a little lesson: hey, maybe give that debugger a try instead of instrumenting your code with 20 print lines... or at least expect some good-natured ribbing if you don’t!
Level 3: Stepping Through Old Habits
At the highest level, this meme pokes fun at a classic debugging dilemma: interactive debuggers vs. print statements. In the top panel, an exasperated character essentially asks, "If you have a debugger, why resort to printf?". The bottom panel’s punchline, “Think Senior, Think”, underscores the frustration. This is a scenario many seasoned developers recognize: an experienced coder (the senior) stubbornly sprinkling printf (or console.log) statements throughout code, even when modern debugging tools are readily available. The humor hits close to home because it flips expectations – the all-powerful superhero (representing logic or best practices) is berating a battle-worn veteran dev for using what some consider a primitive method. It’s a DeveloperExperience_DX gut-punch dressed in comic drama.
Why is this funny to an experienced dev? Because it highlights a real tension in debugging culture. Many of us have been in code reviews or team meetings where someone quips: “We have an interactive debugger, yet Bob still uses print statements like it’s 1995.” The meme exaggerates this in the over-the-top Invincible “Think, Mark, Think” style – blood, rage, and all – turning a mundane code disagreement into an epic showdown. It satirizes the almost religious fervor of the debate: print_debugging versus using a proper debugger.
From a senior engineer’s perspective, there are reasons this debate persists:
- Legacy habits: Developers who grew up on C or simple editors didn’t always have powerful IDEs. Their muscle memory for bug hunting is
printf-> compile -> run -> inspect output. It’s a hard habit to break. - Environment constraints: Sometimes you can’t attach a debugger (imagine debugging a live server, an embedded device, or a Docker container in production). In such cases, strategically placed
printfor logging statements are a lifeline. - Heisenbugs & timing: Pausing a program with a breakpoint can change its behavior (threads timing, race conditions). This is the infamous Heisenbug phenomenon – like how observing something can alter it. Seniors who’ve been burned by a bug disappearing when they hit a breakpoint might prefer logs that don’t disturb runtime as much.
- Simplicity and speed: Writing a quick
printf("x=%d\n", x);and rerunning can sometimes be faster than setting up the debugger, especially in quick-and-dirty scripting or when the dev thinks they know where the issue is. There’s a certain DebuggingFrustration in waiting for an IDE when you can just get a one-line print insight immediately.
However, the counter-argument – and the point of the meme’s angry superhero – is that using an actual debugger is often more powerful and efficient. With breakpoints, watches, and stack inspection, you can pause time inside your program and examine anything, rather than printing dozens of guess-and-check messages. Modern debuggers integrate with editors (think Visual Studio, PyCharm, Chrome DevTools) to provide an interactive exploration of program state. The meme screams: “You’re a senior dev with all these advanced tools at your disposal, how can you still be doing caveman debugging?!” – a hyperbolic call-out that’s equal parts roasting and relatable.
In essence, the meme is a comedic mirror for our industry’s quirks. It highlights how even experienced developers often cling to tried-and-true methods (like the humble printf) despite having “invincible” new tools. The dramatic Think Senior, Think format dramatizes that internal conflict every dev has faced when chasing a bug: Am I doing this the hard way? Could there be a smarter approach? The bloodied, accusatory superhero is basically the voice in our head – or that one no-nonsense colleague – urging us to reconsider our debugging strategy and maybe, just maybe, use the shiny debugger that’s been there all along.
Description
A two-panel meme using the dramatic 'Think, Mark, Think!' scene from the animated series Invincible, where a bloodied Omni-Man stands over his son. The meme humorously recontextualizes this confrontation as a debate over debugging techniques. The top panel has Omni-Man yelling, 'IF YOU HAVE A DEBUGGER, THEN WHY DO YOU USE "PRINT F"'. The bottom panel delivers the punchline, with Omni-Man pointing at his own head and shouting, 'THINK SENIOR THINK'. The joke inverts the typical senior-to-junior dynamic, framing a common question from less experienced developers as an aggressive interrogation. It's a defense of the time-honored practice of using simple print statements for debugging, which senior engineers often find faster and more practical than setting up a full-fledged debugger, especially in complex, distributed, or containerized environments. The meme celebrates pragmatic experience over dogmatic adherence to 'proper' tools
Comments
13Comment deleted
A debugger is great for stepping through your code. A print statement is great for seeing where your code fell off a cliff in production
Ever tried remote-attaching a debugger to a container that just got rescheduled three nodes away? That’s why my printfs are version-controlled - the only breakpoints Kubernetes actually respects
After 20 years, I've mastered every IDE debugger, written custom GDB scripts, and given conference talks on advanced debugging techniques. But when production is down at 3 AM, you'll find me adding print statements because setting up remote debugging through three layers of Docker, Kubernetes, and that legacy service mesh takes longer than the incident postmortem
The real senior move is knowing that printf debugging scales better in distributed systems, works in production without attaching processes, survives across restarts, and doesn't require IDE setup - but we'll still pretend we're 'just quickly checking something' when caught adding console.logs to a 10-year-old codebase at 2 AM
Print F: the senior dev's eternal flameout - debuggers crash on prod minification, but logs whisper secrets eternally
In a k8s rollout with five replicas and a timing-sensitive Heisenbug, the only debugger with high availability and full-text search is grep
Because in prod, a breakpoint is just a polite DoS; printf with a correlation ID is the only debugger that scales across pods, retries, and Kafka
Because logs always work. Also good luck with debugging timeouts. Comment deleted
This. Comment deleted
Because tracing != debugging Comment deleted
because. It. Fucking. Works Comment deleted
To pay respect, obviously Comment deleted
Holy Shit, I've never thought about it. 😂 Comment deleted