Skip to content
DevMeme
5609 of 7435
LLM Benchmark Scorecard: The AI Hunger Games
AI ML Post #6155, on Aug 14, 2024 in TG

LLM Benchmark Scorecard: The AI Hunger Games

Why is this AI ML meme funny?

Level 1: Battle of the Brainy Bots

Imagine a bunch of kids in a classroom comparing their test scores. There’s a big poster on the wall listing different subjects – math, history, science, even a coding test – and next to each subject, it shows what score each kid got as a percentage. Now, one new kid (let’s call him Grok) just joined the class, and he’s eager to prove himself. The poster shows that in some subjects, Grok scored even higher than the class’s usual top student (who we can call GPT-4). For example, on the math test, both Grok and GPT-4 got almost the same very high score, but on the “reading a document and answering questions” test, Grok actually got a tiny bit higher score. All the other kids (Claude, Gemini, Llama… they have funny nicknames!) are there on the chart too, with their scores in each subject. Some are really good at one thing and less good at another, just like real kids – maybe one is great at history but not so good at math, etc. This chart is basically Grok saying, “Look everyone, I did really well – in fact, I beat the star student in a few areas!” The humor of it is like a friendly rivalry; it’s as if these AI models are schoolkids bragging about who aced which test. Everyone’s ooh-ing and ahh-ing because a new kid almost matched the class topper. In simple terms, the meme is funny because it turns serious AI model comparisons into a kind of report card bragging session – you don’t need to know the deep details to get that it’s about one AI trying to show it’s as smart (or smarter) than the others by comparing their “grades”. It’s the AI version of kids saying, “I got a 95, what did you get?”.

Level 2: AI Report Card

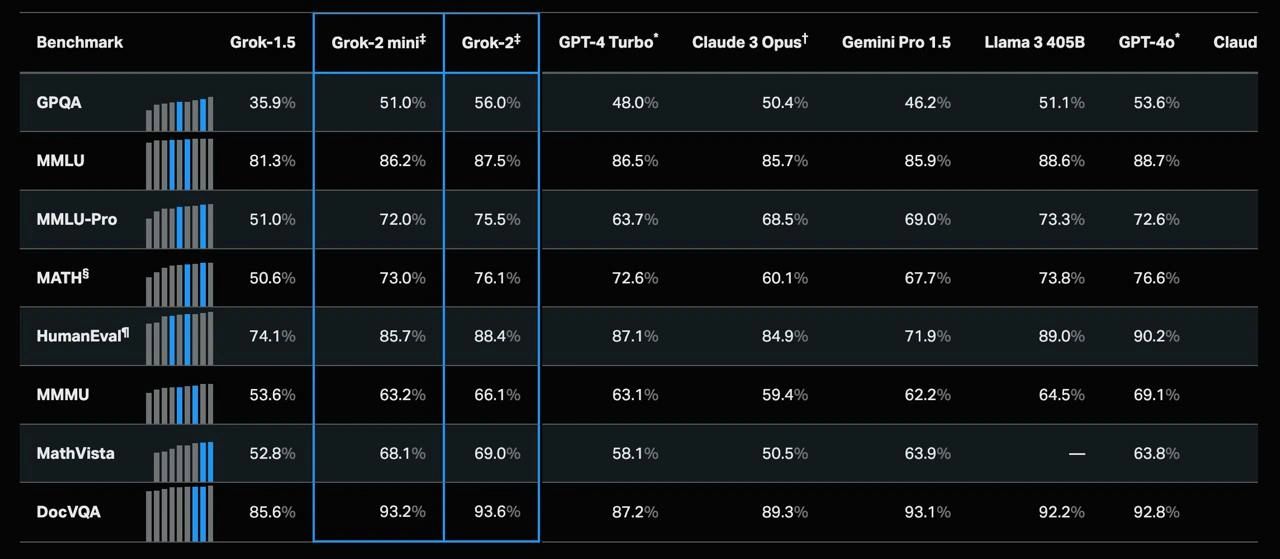
Think of this table as a giant report card comparing different AI models on various subjects. Each row is like a test or subject, and each column is a different AI model (kind of like a student in the class). The numbers are the scores (percent correct) each model got on that test. A 100% would mean perfect score on that benchmark, and 0% would mean total failure. So for example, on the GPQA test (the first row), Grok-1.5 scored 35.9% (like getting about 36% of the questions right – not great), while Grok-2 scored 56.0% (a solid improvement, more than half right). Meanwhile, the well-known GPT-4 Turbo got 48.0% on that same test. So in that “subject,” Grok-2 actually outperformed GPT-4 Turbo. The table is full of these comparisons for eight different benchmarks. The blue bars next to the numbers for Grok models indicate those are the ones being highlighted – they belong to the company xAI (which made the Grok models), so they’re coloring their own scores in blue to stand out. The gray bars are the other models. Longer bars mean higher scores. If a bar is nearly full across the cell, that model did really well on that test compared to the others.

Now, what are these benchmarks (tests) exactly? They’re labeled with acronyms and sometimes special symbols (like § or ¶) because they correspond to specific academic or industry test sets. Let’s decode them in simpler terms:

  • GPQA – This likely stands for General Purpose Question Answering. It’s presumably a broad quiz of many topics to see if the model can answer general questions. Think of it like a trivia or general knowledge exam for the AI. A score of 56% means it got just over half the questions correct. Grok-2 leading here suggests it’s pretty good at wide-ranging Q&A.
  • MMLU – This stands for Massive Multitask Language Understanding. It’s a famous benchmark in AI. Imagine an exam with 57 subjects ranging from history to math to biology (literally, it includes a bit of everything, even niche topics like antiquities or veterinary science). The model gets tested on all of them. An 87.5% score (what Grok-2 got) is really high – it means the model answered nearly 87 out of 100 questions correctly across all those subjects. By comparison, Grok-1.5 got 81.3%, and the best model listed (GPT-4o, possibly the original GPT-4) got 88.7%. So Grok-2 is almost topping this, just a hair behind the very best. This shows how much these AIs have “studied” a broad range of knowledge.
  • MMLU-Pro – The “Pro” suggests a professional or advanced extension of MMLU. If MMLU is like undergrad trivia, MMLU-Pro might be like questions at the level of professional exams (say, medical board questions, law, advanced engineering, etc.). Grok-2 scored 75.5% here, which is again quite high. It beats GPT-4 Turbo (63.7%) by a wide margin and even edges out Llama 3 405B (73.3%). This tells us Grok-2 is not just good at everyday facts but also at high-level, specialized questions.
  • MATH§ – This refers to a math benchmark (the § likely points to a footnote citing the source of the math dataset). It’s probably a set of math problems that could include algebra, calculus, word problems – possibly something like the MATH dataset that has competition-level math questions. A score of 76.1% for Grok-2 indicates it solved about three-quarters of the problems, which is excellent (math is a hard subject for AIs because it requires step-by-step reasoning, not just memory). GPT-4 (original) got 76.6%, essentially the same, and they both leave models like Claude 3 (60.1%) far behind. So Grok-2 has basically caught up to GPT-4 in math skills, which is impressive.
  • HumanEval¶ – This is a coding test. The ¶ means there’s likely a footnote about it, but essentially HumanEval is a benchmark where the model has to write code to solve programming problems (originating from OpenAI’s evaluation suite). The percentage is how often the AI’s code passes all the unit tests for those problems. Grok-2’s score is 88.4%. That means if you gave it 100 coding tasks, it wrote correct code for about 88 of them. GPT-4 (original) is at 90.2% here, slightly higher (GPT-4 is known to be extremely good at coding). Llama 3 also shows a strong 89.0%, which is notable. So in coding, Grok-2 is very good, nearly on par with the best. A junior dev can appreciate that these AIs can solve programming challenges – something that used to be a very human skill.
  • MMMU – This one is a bit of a mystery acronym, but given the context and the scores, it likely means Massive Multimodal Understanding or Multilingual Multitask Understanding. The key is the double ‘M’ at the start, which probably extends the idea of MMLU to something else. If it’s multimodal, it means the test might involve images or other formats besides text. If it’s multilingual, then the questions could be in various languages. The relatively lower scores (Grok-2 at 66.1%, GPT-4o at 69.1%) suggest it’s a tougher challenge. Perhaps the models had to handle questions with images or in languages they aren’t as fluent in. In any case, Grok-2 does second best here, a bit behind GPT-4’s original, showing it can juggle either multiple languages or multiple types of data reasonably well.
  • MathVista – This sounds like another math-related benchmark, possibly one involving visuals (the name “Vista” hints at vision). It could be something like interpreting graphs or images in math problems, or maybe it’s just a fancy name for a set of hard math questions. The data shows Grok-2 got 69.0%, whereas GPT-4 Turbo managed only 58.1% and GPT-4 original got 63.8%. Interestingly, Llama 3 had no entry here (perhaps it wasn’t tested on this or the data wasn’t available, hence the blank “—”). Grok-2 clearly outperforms all listed rivals on MathVista, which suggests xAI put effort into training or fine-tuning the model for complex math problems, possibly even ones that involve visual understanding (like reading a diagram or chart to answer a question).
  • DocVQA – This stands for Document Visual Question Answering. It is a well-known type of benchmark where an AI is shown an image of a document (like a form, article, or invoice) and asked questions about it. It tests whether the model can read and comprehend text from images – combining computer vision (to read the text from the image) and language understanding (to answer questions about the content). Grok-2 scored 93.6% here, meaning it got almost all the questions right, slightly beating GPT-4 (87.2% for Turbo, 92.8% for original) and others like Claude (89.3%) and Llama 3 (92.2%). That implies Grok-2 is excellent at reading and understanding documents, a crucial skill for AI assistants that might, say, parse PDFs or scanned forms for you. Since xAI is highlighting this, they want to show their model isn’t just good at pure text but can handle multimodal tasks involving vision, too.

And what about the columns (the models) themselves? Let’s break down who these “competitors” are:

  • Grok-1.5, Grok-2 mini, Grok-2 – These are the models from xAI. Grok is a slang from sci-fi that means “to deeply understand,” so it’s a fitting name for an AI. Grok-1.5 might be an earlier version or a smaller model (the numbering suggests version 1.5). Grok-2 is the new flagship model, and they even have a Grok-2 mini, which likely is a lighter, faster version of Grok-2 with fewer parameters (we can infer it because its scores, while much improved over Grok-1.5, are a tad below the full Grok-2, e.g., 72.0% vs 75.5% on MMLU-Pro). xAI is essentially saying: “We have our main model and also a mini model that still does really well.” The blue outline around the Grok-2 columns in the image was probably to highlight “these are our guys!”
  • GPT-4 Turbo* – GPT-4 is the famous model from OpenAI (creators of ChatGPT). The “Turbo” version likely refers to a faster or more optimized variant OpenAI offers. Turbo might run quicker or allow more input length, but possibly at slightly reduced accuracy compared to the original GPT-4. The asterisk (*) next to it suggests there was a footnote explaining what Turbo means (something like “*Turbo version uses a 16k token context and has slightly lower quality on some tasks, per OpenAI’s July 2024 update” – that’s a guess, but usually such tables clarify these things). GPT-4 Turbo’s scores are good but generally a notch below the best, which aligns with it being a trade-off version of GPT-4 aimed for efficiency.
  • Claude 3 Opus† – Claude is another advanced AI model, made by Anthropic. They had Claude 2 around mid-2023, so Claude 3 would be their next iteration. “Opus” might be a code name or the version name (Anthropic likes musical or classical names; e.g., they had a Claude variant called “Claude Instant”). The † likely refers to a footnote describing maybe the context length or some parameter of this model (for instance, Claude 2 was known for being able to handle very long documents, so Claude 3 Opus might continue that). In the table, Claude 3’s performance (like 50.4% on GPQA, 85.7% on MMLU, 84.9% on HumanEval) is solid but not chart-topping. It’s roughly on par with GPT-4 Turbo in many cases. This suggests that by this point, a lot of these major models are in a similar ballpark, with strengths and weaknesses varying per task.
  • Gemini Pro 1.5 – This refers to Google’s upcoming model Gemini. Google announced they were working on a big new AI (successor to their PaLM 2, etc.) named Gemini. The “Pro 1.5” sounds like a specific version or tier of it – maybe an intermediate version (1.5 could mean an improved version of a base Gemini). Since it’s included here, it implies Google’s model is part of the comparison. We see scores like 46.2% on GPQA and 85.9% on MMLU, which are fairly good (MMLU 85.9% is just slightly below Claude and Turbo). It’s possible Gemini’s strength might lie elsewhere not fully captured here, given it’s not dominating these particular metrics.
  • Llama 3 405B – Llama 3 would be the successor to Meta’s open-source Llama 2. The number 405B almost certainly refers to the number of parameters (the internal “neurons” or weights in the model). 405 billion parameters is huge – for comparison, Llama 2’s largest version had 70B, and GPT-4 is rumored to be around 180B (OpenAI hasn’t confirmed exact numbers, but it’s in that range). So 405B would mean Llama 3 is more than double GPT-4’s size. The scores show Llama 3 doing extremely well on pure knowledge tests (88.6% on MMLU, basically tied for top, and 73.8% on MATH, 89.0% on HumanEval). That indicates scaling up the model size has indeed made it very knowledgeable and proficient, rivaling the best. However, bigger isn’t always better for every category – we see it didn’t have a listed result for MathVista (maybe not evaluated or not good at that specific one) and its GPQA is 51.1%, which Grok-2 surpasses. Still, Llama 3 being in this table shows that even open models (if Llama 3 gets released openly like Llama 2 was) are reaching top-tier performance, which is a big industry trend.
  • GPT-4o* – This likely denotes the original GPT-4 model (the “o” perhaps for “original” or “openai’s base”, and the * again indicating a footnote maybe like “*Using the March 2024 version of GPT-4 with 8k context”). GPT-4 original has excellent scores across the board – it still has the highest in a few rows (90.2% on HumanEval, 69.1% on MMMU, slightly leading in MMLU and MATH by a hair). This is the model that set the standard. The fact that Grok-2 is matching or beating GPT-4 in many areas is meant to impress us: GPT-4 was the king, so beating the king even in one test is a bold claim by xAI.
  • Claud… – The last column is truncated in the image, but given the context, it’s likely another column for a variant of Claude or something similar (perhaps “Claude Instant 3” or an older Claude). Its numbers (if we extrapolate from the partial view: GPQA ~53.6%, MMLU ~88.7%, MMLU-Pro ~72.6%, etc.) look close to GPT-4’s. It might even be that column is GPT-4 *something or other. However, since the label is “Claud…”, it suggests another Anthropic model. In any case, it’s partially cut off, so we don’t need to worry too much – the main idea is there were numerous models in this comparison.

In plainer words, this image is show-and-tell for AI model performance. It’s geared towards engineers and researchers (large_model_evaluation folks) who love to see the numbers. The competitive vibe – Grok-2 vs GPT-4 vs Claude vs Gemini vs Llama – is like a tech leaderboard where everyone wants the top spot. If you’re a junior dev just stepping into the AI world: yes, it’s normal to have so many weird acronyms and names. Each name either refers to a model (like GPT or Llama) or a test dataset (like MMLU or HumanEval). As confusing as it looks, once you break it down like above, it’s basically a comparison chart, not unlike a features or specs table you might see in a device review – but here the “features” are how well the AI can handle different intellectual tasks. The excitement (and the joke) around this meme comes from the fact that in AI circles, these numbers are hotly debated and celebrated. People might even root for one model or another (some are Open Source fans who cheer for Llama, others trust OpenAI, some are curious about Elon’s xAI Grok, etc.). It’s a bit like a sports scoreboard for AI enthusiasts.

Level 3: Benchmarks & Bragging Rights

Why do developers find this comparison table meme-worthy? Because it captures the AI industry trends in one image: the constant hype cycle of “New Model X beats Model Y on benchmark Z!”. It’s a tableau of one-upmanship that anyone in machine learning has seen before. Just like gamers compare high scores, AI labs compare benchmark scores. Here, the newcomer Grok-2 (from Elon Musk’s company xAI) is boldly flexing against the established players – GPT-4 (the gold standard from OpenAI), Claude from Anthropic, Google’s rumored Gemini, and Meta’s Llama 3. The meme has a tongue-in-cheek “GPT-4 Turbo and friends” vibe, as if GPT-4 and its cohort are a clique of cool kids and Grok-2 is the new kid trying to prove it belongs. The humor comes from how ridiculously specific and acronym-heavy this table is – it’s like insider baseball for AI folks. One glance and an experienced dev goes, “Wow, they’re really pulling out every acronym in the book: GPQA, MMLU, MMMU…what’s next, XYZ-PQR benchmark?” It’s both impressive and a little comical how many specialized tests exist just to claim your AI model is the “best” at something.

Look at the way the table is formatted: the blue boxes highlighting Grok-1.5, Grok-2 mini, and Grok-2 indicate those are the host team – xAI’s own models, given special emphasis. All their bars are in bright blue, drawing your eye to how well they are doing. This is a classic bit of visual bragging in tech presentations: make your product’s line bigger and bluer. And sure enough, the Grok family is scoring surprisingly high. For instance, Grok-2 nails DocVQA with 93.6%, slightly edging out the mighty GPT-4 (listed as GPT-4o* in the table, presumably the original GPT-4) at 92.8%. It also beats others on MMLU-Pro and ties the top on MATH. The meme winks at us: “See? The new guy is as good as (or better than) the big guns on their home turf!” It’s as if a rookie challenger just showed up and matched the star player’s record – cue the dramatic anime gasp from the competition.

From a seasoned developer’s perspective, there’s an element of déjà vu. We’ve seen leaderboard hype across the years in different forms. In the 2010s, it was image recognition benchmarks (ImageNet winners boasting 0.1% better accuracy), then it was GLUE and SuperGLUE for NLP, and now it’s this smorgasbord of LLM tasks. The meme is basically the AI equivalent of a spec sheet brag. And any veteran engineer knows to take these with a grain of salt. Are these models truly better in practical usage, or are they just optimized to ace the tests? That’s the unspoken joke: in the real world, your mileage may vary. Maybe GPT-4 Turbo scores a bit lower on academic benchmarks, but it might still feel smarter in conversation or be more reliable. Or perhaps Claude 3 Opus (Anthropic’s next model, hinted by that name) is specialized in doing really long documents (Claude is known for huge context windows) so it might not shine as brightly on short-form quizzes like MMLU but would win in other unlisted categories. The table doesn’t show metrics like truthfulness or lack of toxicity or speed, which are harder to quantify but very important in deployment. A grizzled AI engineer might chuckle knowing that each company chooses benchmarks that flatter their model. For example, if Grok-2 had a particularly strong training on math problems, no wonder it’s topping MathVista; likewise, OpenAI often excels on code tasks (hence GPT-4 still topping HumanEval with 90.2%). There’s a bit of strategy: you highlight the contests you win and quietly omit those you lost. Notice we don’t see an “conversation quality” or “creativity test” here – maybe GPT-4 would dominate those, who knows? The meme’s comedic realism is that every AI lab (now including xAI) is in a race and they all love waving around tables of numbers to say “We’re #1 (in these cherry-picked scenarios)!”

This image also pokes at the proliferation of model names and versions – it’s alphabet soup. To an experienced dev, names like GPT-4 Turbo, GPT-4o, Claude 3 Opus, or Gemini Pro 1.5 sound both grand and vaguely cartoonish. GPT-4 Turbo (with an asterisk to boot) evokes a sports car edition of GPT-4 – faster but maybe not as heavy-duty. Claude 3 Opus† sounds like a code name for a sophisticated AI (Anthropic really calling it “Opus” makes it feel like an opera performance of AI). Gemini Pro 1.5 hints Google’s repeating their tactic from models like PaLM – perhaps a half-step upgrade in a series – and Llama 3 405B screams “bigger is better!” by flaunting parameter count in the name. We even have an almost mystery column cut off as “Claud…”, likely another Claude variant not fully visible (which itself is a bit humorous – the meme image literally cut off one of the many model columns, as if saying “there are too many models to fit!”). For those in the AI industry, this all feels familiar and slightly absurd. The AI tools landscape is evolving so fast that we have to compare not two or three models, but nine or ten at a time! It’s like a crowded race track. Keeping up with these names and their capabilities has become its own chore (hence the tag AIIndustryTrends – trend indeed: new model every few months). So, the meme resonates by summarizing the madness: an overload of acronyms and percentages which, to insiders, tell a story of intense competition and hype. It’s both informative (hey, look how Grok-2 mini even beats GPT-4 Turbo on GPQA!) and facetiously over-the-top. It says, “If you know, you know… and if you don’t, good luck deciphering this!” – which is exactly the mix of pride and humor that a lot of devs share about the rapid progress in AI.

Level 4: The Law of Large Models

At the cutting edge of AI research, there’s an almost scientific obsession with benchmark leaderboards. These are essentially the Olympics of AI tasks, and each new LLM (Large Language Model) tries to outshine the last by a few percentage points. The meme’s table is an advanced scoreboard of model intelligence: it pits xAI’s latest Grok-2 models against well-known giants like GPT-4 variants, Claude 3 Opus, Google’s Gemini, and Meta’s Llama 3. Under the hood, this is about emergent abilities and scaling laws in machine learning. Researchers have observed that as you increase model size or training data, performance on certain tasks can suddenly leap – an effect often called an emergent behavior. For example, solving complex math problems or writing correct code might be practically impossible for smaller models, but beyond a certain model size (say, hundreds of billions of parameters) the success rates jump from near-random to surprisingly high. This table captures that dynamic: notice how Llama 3 405B (with a staggering 405 billion parameters) and Grok-2 (presumably also very large) score exceptionally well on knowledge tests like MMLU (over 87%+). It’s scaling laws in action – bigger models tend to know and grok more.

But raw size isn’t everything. There’s also the question of architecture and training. Each row here corresponds to a specialized evaluation: some test factual recall, some test reasoning, some test coding, and others even test multimodal understanding (like reading images in DocVQA). A truly advanced insight is that models can be specialized or fine-tuned to excel at certain benchmarks. For instance, HumanEval (a coding benchmark) can improve dramatically if a model was trained on a lot of code or taught to “think step-by-step” (using techniques like chain-of-thought prompting or fine-tuning on code solutions). So a savvy observer might ask: are these models being cherry-picked or fine-tuned for these very tasks? In the arms race for state-of-the-art (SOTA) results, it’s known that focusing too much on specific benchmarks can lead to overfitting to them (like a student who only studies past exam questions). Goodhart’s Law lurks in AI metrics: when a performance measure becomes a target, it can lose its original meaning. A model might score 90% on MATH by memorizing common solutions or exploiting quirks in the test format, without genuinely mastering mathematics. The meme’s humor, from a theory perspective, is in how seriously we treat these numeric differences – as if a 0.5% edge in MMLU is a profound leap in “intelligence”. It’s poking at the fact that defining and measuring “intelligence” or “reasoning” in machines is fiendishly complex. Each benchmark (GPQA, MMLU, etc.) is like a proxy for some facet of intelligence, but none individually captures the whole. Yet here we are, treating an AI benchmarking table like a scoreboard of a sports game – a quantified battle to inch closer to human-like capabilities.

On the theoretical front, this table also highlights the multimodal evolution of LLMs. Benchmarks like MathVista and DocVQA indicate that models are being tested on visual or multi-format input (like interpreting images or complex visual data). This is a direct nod to how modern “language” models aren’t just about language anymore – they’re morphing into foundation models that can handle text, code, images, maybe even audio. We’re seeing the convergence of NLP with computer vision in these metrics. Handling something like DocVQA (which usually means reading a document image and answering questions) requires integrating a vision model with a language model. That’s a sophisticated capability: essentially multimodal understanding. From a systems perspective, this could involve combining a Transformer-based text encoder with a CNN/ViT image encoder, or using one giant model trained on image-text pairs. The fact that Grok-2 scores ~93.6% on DocVQA – edging out GPT-4 and others – hints that xAI has engineered strong vision+language integration. It’s a subtle brag that “our model not only chats well, it sees well too.” For experienced researchers, this evokes the question of architectural differences: Did Grok-2 use a novel approach for vision? Is it using retrieval augmentation for knowledge tasks? How is it achieving these numbers? The meme’s technical punchline is that behind each of these percentages lies a myriad of engineering choices and theoretical considerations (transformer depth, training dataset composition, context length, fine-tuning strategies). We’re essentially witnessing a parameter and algorithm arms race distilled into a neat table of numbers. It’s both impressive and a bit absurd: impressive because the progress is real (just a year or two ago, these benchmarks had much lower tops), and absurd because so much of the AI community’s attention revolves around bragging rights for fractional improvements on curated tests.

Description

A dark-themed performance chart comparing various large language models (LLMs) across multiple industry-standard benchmarks. The table is structured with benchmarks listed in the first column, including GPQA, MMLU, MMLU-Pro, MATH, HumanEval, MMMU, MathVista, and DocVQA. Subsequent columns show the percentage scores for different AI models: Grok-1.5, Grok-2 mini, Grok-2, GPT-4 Turbo, Claude 3 Opus, Gemini Pro 1.5, Llama 3 405B, and GPT-4o. Each benchmark row features small bar graph icons, visually representing the performance metric. The overall image presents a competitive landscape of AI development, where various companies and their models are pitted against each other in a race for higher scores. For a technical audience, this chart is a dense summary of the current state-of-the-art in AI, sparking discussions about benchmark integrity, model specialization, and the rapid pace of progress in the field

Comments

7
Anonymous ★ Top Pick The real winner of the LLM benchmarks isn't on the chart; it's the engineer who figures out how to run the evaluation script without OOMing on a 96-core machine with 2TB of RAM
  1. Anonymous ★ Top Pick

    The real winner of the LLM benchmarks isn't on the chart; it's the engineer who figures out how to run the evaluation script without OOMing on a 96-core machine with 2TB of RAM

  2. Anonymous

    LLM benchmark tables now read like SaaS pricing grids: ten bold percentages, six footnotes, and the cheerful assumption your production workload is exactly 40% GPQA, 30% MMMU, and 30% whatever MMLU-Pro actually measures

  3. Anonymous

    Looking at another benchmark leaderboard where being 0.3% ahead means your entire engineering org gets to pretend they invented AGI while conveniently ignoring that all these models still hallucinate their way through basic arithmetic

  4. Anonymous

    When your new model's benchmark scores look this good, you know someone on the team definitely spent three weeks optimizing specifically for MMLU instead of fixing that production bug. But hey, 93.6% on DocVQA means it can finally read the incident reports about why the last deployment failed

  5. Anonymous

    Cool leaderboard - accuracies everywhere and more footnotes than a legal contract (†‡§¶*). Wake me when someone posts the real SOTA: p99 latency, cost per 1k tokens, and “returns valid JSON without hallucinating.”

  6. Anonymous

    Procurement asked which model to standardize on; we standardized on an adapter, because the only benchmark that never regresses is how fast this table changes

  7. Anonymous

    GR6 scaling units > Llama parameters: hardware wins the inference arms race

Use J and K for navigation