
TechDebt Post #7045 · source on Telegram
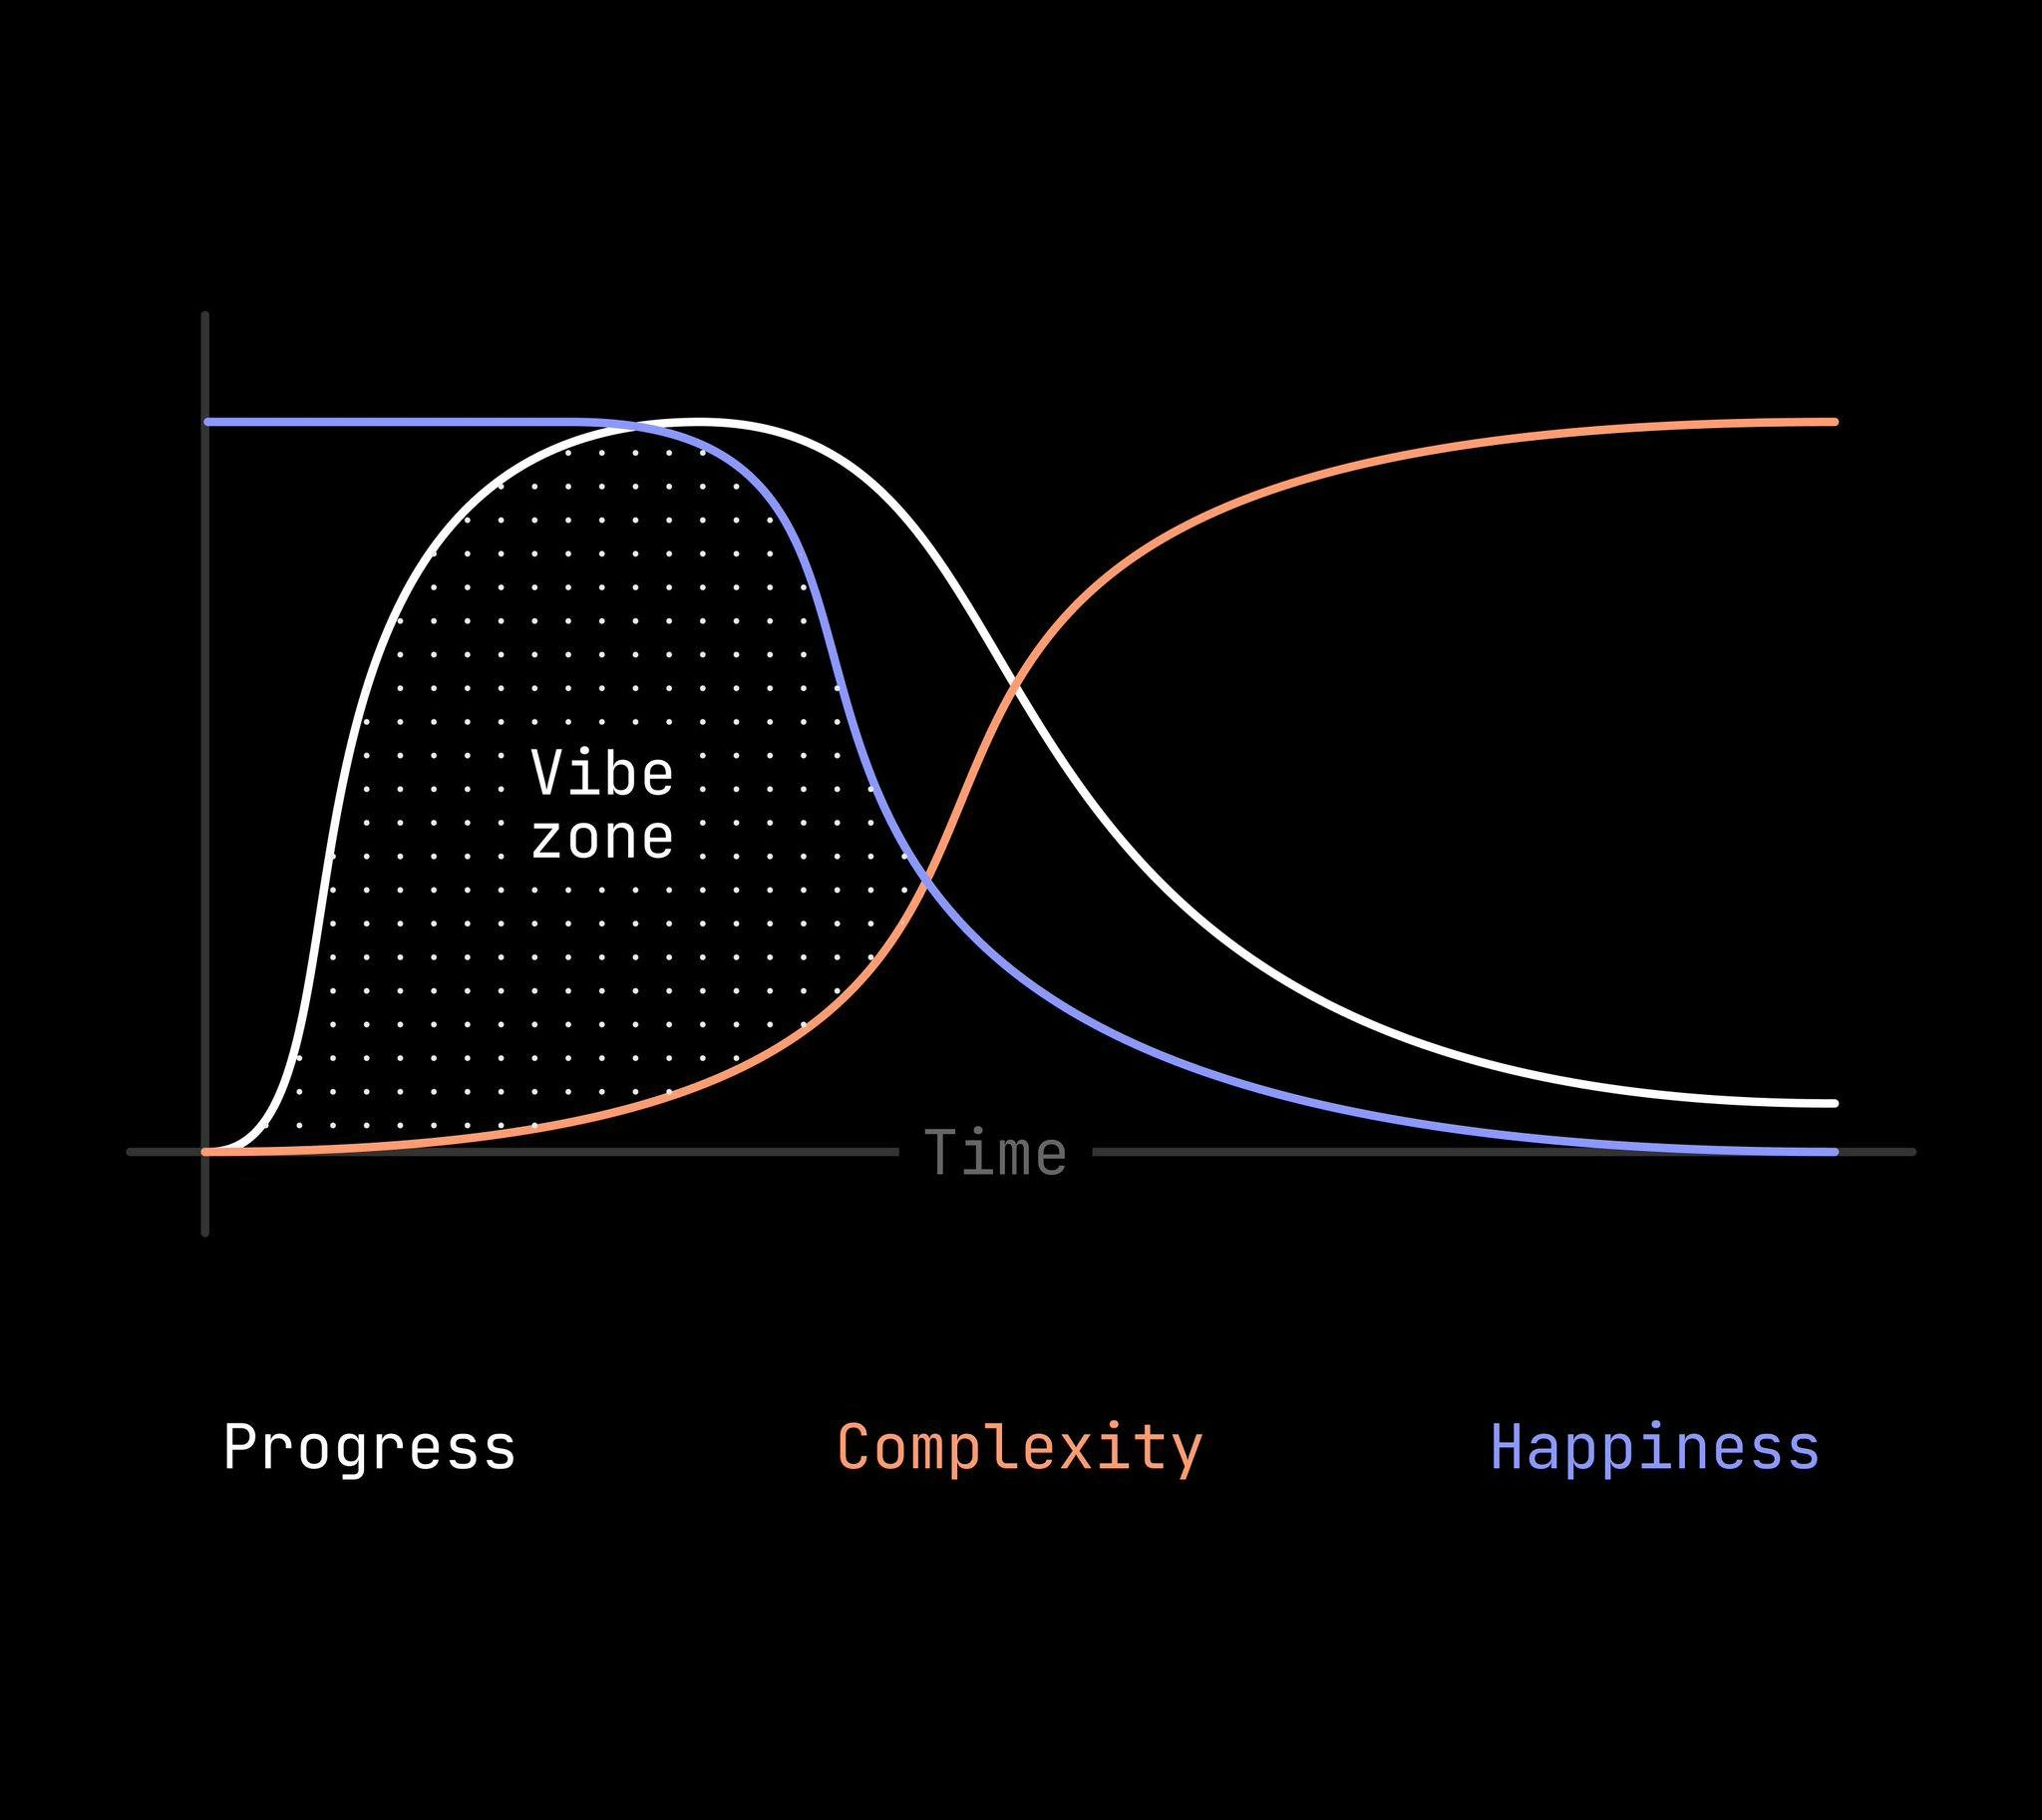
Vibe Coding Graph: Progress, Complexity, and Happiness Over Time
Description
A graph on a black background plotting three curves over time: Progress (white), Complexity (orange/red), and Happiness (blue/purple). There is a dotted region labeled 'Vibe zone' where progress is high and complexity is still low - the sweet spot of vibe coding. As time progresses, the progress curve peaks and drops sharply while complexity skyrockets. Happiness stays high initially then plummets as complexity takes over. The 'Vibe zone' occupies only a brief early window, perfectly capturing how AI-assisted 'vibe coding' feels amazing at the start but rapidly collapses as the project grows beyond trivial complexity
More like this
More like this in TechDebt →

Use J and K for navigation
Comments
16Comment deleted
The vibe zone: that magical 48 hours where you mass-produce features at lightspeed, right before the complexity curve goes vertical and you realize the AI wrote 12 different state management patterns in the same file
The 'Vibe Zone' is that brief, magical period where you think the initial architecture will scale, all the TODOs are minor details, and 'we'll refactor it later' sounds like a viable long-term strategy
You can pinpoint the exact spline where the architect declares, “We’ll just add one more layer of abstraction,” and the happiness graph starts paging out to disk
After 20 years in tech, I've learned the 'vibe zone' is just the brief moment between 'we've solved the problem' and 'wait, we've created seven new architectural concerns and now need a distributed consensus protocol for what used to be a simple boolean flag.'
The 'vibe zone' is that magical two-week window after the greenfield excitement wears off but before you realize the architecture decisions you made at 2 AM were actually terrible. It's when the codebase is complex enough to feel like real engineering, but not so complex that you need a PhD and three whiteboards to explain the deployment process. Enjoy it while it lasts - because once that complexity curve peaks and happiness flatlines, you'll be the one writing 'TODO: refactor this entire module' comments that will haunt the next team for years
That crossover where complexity beats progress is the exact moment sales closes an enterprise deal and your backlog turns into SSO, RBAC, audit logs, and a migration plan - your happiness becomes an exponential decay function
Projects obey the CAP theorem: pick any two from Progress, low Complexity, sustained Happiness
The dotted “Vibe zone” is that brief sprint between hello world and “please add SSO, GDPR, billing, retries, observability, and multi‑region,” where complexity compounds interest and converts developer happiness directly into tech debt
My happiness is a sine with peaks coinciding with progress peaks following the complexity peaks, idk what this chart is about Comment deleted
No tests = big happy Comment deleted
Progress should have an alternate path that goes below 0 if you start vibe debugging Comment deleted
What is vibe debugging? The code is absolutely correct Comment deleted
Asking an LLM to help fix the code it generated Comment deleted
I just hope you do it with CLI tools and with llm having access to the rest of project and recent logs in terminal (and browser's console in case of fe) Comment deleted
This sounds like debugging with (potentially) broken support wheels. I prefer the gcc compiler screaming at me until i figure it out 🥰 Comment deleted
Which works great until Claude insists build completed successfully when it didn't, or it tries to fix a non-existent build error, or just gives up because it can't figure out the right gradle command Comment deleted