
Prometheus vs. The Printer: A Port 9100 Horror Story
Description
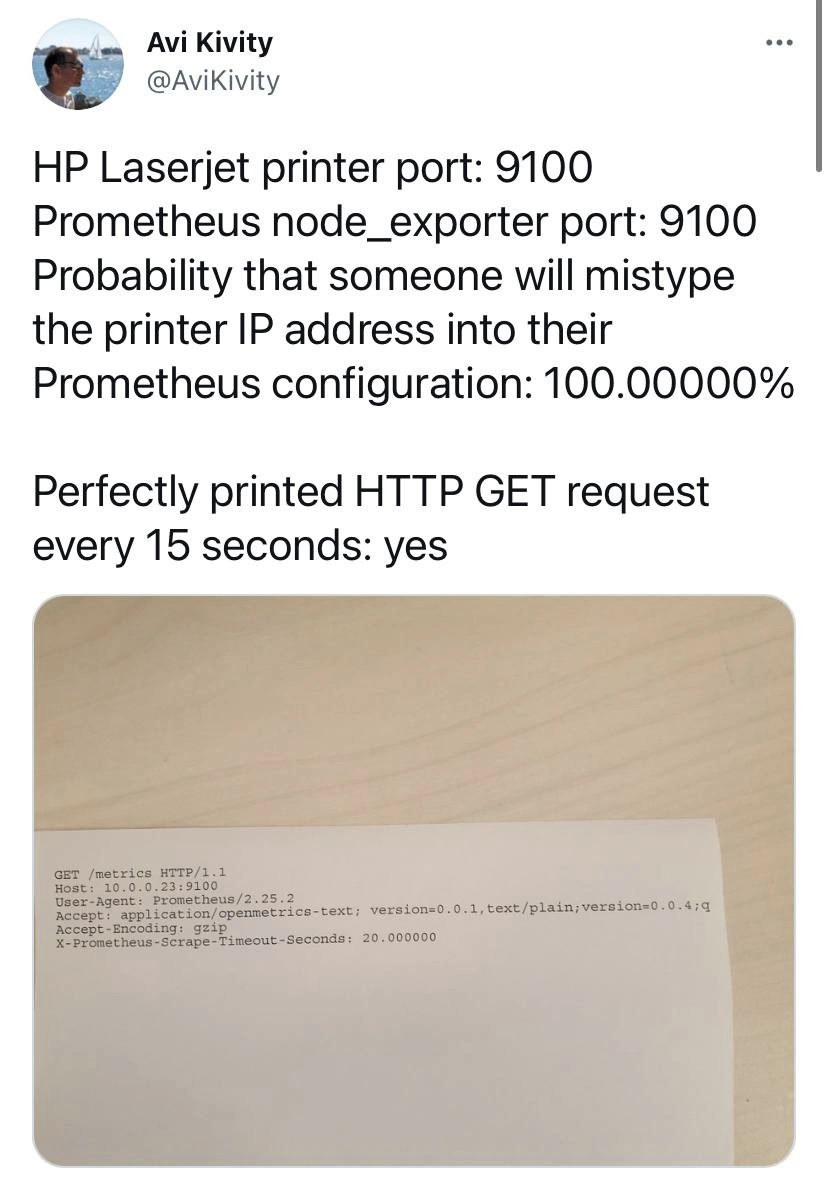
This image is a screenshot of a tweet by Avi Kivity (@AviKivity). The text describes a scenario where an HP Laserjet printer and the Prometheus node_exporter both use the same default port: 9100. The tweet humorously states there's a 100% probability someone will mistype the printer's IP address into their Prometheus configuration, leading to 'Perfectly printed HTTP GET request every 15 seconds: yes'. Below the text is a photo of a piece of paper that has been printed from a printer. The printed text is a raw HTTP GET request, including headers like 'GET /metrics HTTP/1.1', 'Host: 10.0.0.23:9100', 'User-Agent: Prometheus/2.25.2', and 'X-Prometheus-Scrape-Timeout-Seconds: 20.000000'. The joke is a classic example of a 'fat-finger' configuration error. An engineer, intending to scrape metrics from a server, has accidentally pointed their monitoring tool (Prometheus) at a network printer. The printer's JetDirect protocol on port 9100 simply interprets the incoming data stream - the HTTP request from Prometheus - as raw text to be printed, resulting in a continuous waste of paper and a monitoring alert that never fires


Comments
13Comment deleted
Finally, a monitoring system with a hard-copy audit trail. Now let's see if the ink costs more than the AWS bill
Mistyped the node_exporter IP, so the LaserJet now prints GET /metrics every 15 s - finally achieved immutable paper logs with infinite write-ahead buffering and a retention policy that depends solely on who takes out the recycling
Finally found a monitoring solution with a paper trail that auditors will actually believe exists
When your observability stack becomes a little too observable - nothing says 'production incident' quite like your printer generating a paper trail of Prometheus scrape requests. At least you'll have physical evidence for the postmortem: 'Root cause: someone fat-fingered an IP in the scrape config, turning our HP into the world's most expensive metrics exporter with a 15-second SLA on toner depletion.'
When service discovery is a spreadsheet and everything listens on 9100, Prometheus implements dead-tree logging with a janitor-based retention policy
Prometheus scrape configs: where one extra zero turns observability into a bottomless print queue
Accidentally added the LaserJet’s IP to Prometheus (9100); now our observability has a literal paper trail - GET /metrics every 15s, retention policy: until the tray runs dry
What Comment deleted
9100/TCP port is used for PDL (Page Description Language) datastream which by default treats everything as a text and starts the actual print when a connection is closed. Comment deleted
TIL ty for the info Comment deleted
Lol what I thought printers had an inability to process data unless you're using the right driver Comment deleted
Driver acts as a bridge bw the system and printer. Comment deleted
how to print out requests LOL Comment deleted