Skip to content
DevMeme
7095 of 7435
Your Infrastructure Now Exists to Keep Prometheus Running
Observability Monitoring Post #7779, on Mar 2, 2026 in TG

Your Infrastructure Now Exists to Keep Prometheus Running

Why is this Observability Monitoring meme funny?

Level 1: The Babysitter Who Needs a Babysitter

Imagine hiring a babysitter to watch your kids — sensible. But this babysitter eats everything in your fridge, needs her own special room, and gets so overwhelmed that you hire a second babysitter just to look after the first one. Pretty soon the whole household schedule revolves around keeping the babysitters fed and happy, and the kids barely get a glance. That's the joke: a tool hired to keep an eye on things grew so demanding that everything now runs in service of the tool. It's funny because everyone's had a "helper" — an app, a gadget, a routine — that ended up being more work than the thing it was supposed to help with.

Level 2: What Prometheus Actually Does

  • Prometheus is the de-facto standard open-source monitoring system in the Kubernetes world. It periodically scrapes (HTTP-fetches) numeric measurements — CPU usage, request counts, error rates — from your services and stores them as time series: streams of timestamped values.
  • A TSDB (time-series database) is the storage engine underneath. Prometheus's TSDB is fast but memory-hungry, and its appetite grows with the number of distinct series.
  • Labels are key-value tags on metrics (status="500", region="eu"). Every unique label combination creates a new series — that multiplication is what "cardinality" means, and why one careless label can melt a server.
  • Alerting rules watch those series and page a human when thresholds are crossed.

The irony the tweet names: the watcher needs watching. Your first week on an ops rotation often includes a surreal ticket like "Prometheus is down, so we don't know if anything else is down" — the monitoring system is a single point of visibility, which makes it the most critical service you run, which means it gets the most resources, redundancy, and 3 AM attention. Monitoring was supposed to be the cheap thermometer; instead it became the patient.

Level 3: The Tail Wagging the Dashboard

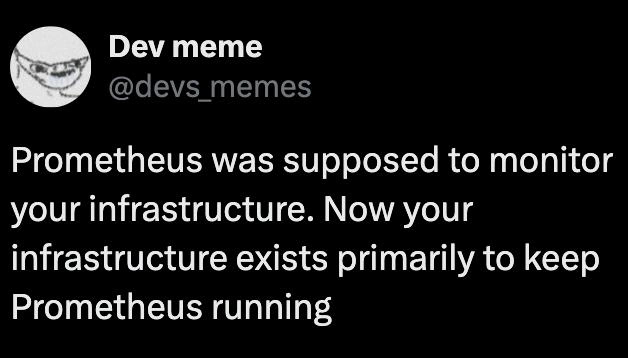
Prometheus was supposed to monitor your infrastructure. Now your infrastructure exists primarily to keep Prometheus running

A single dark-mode tweet from "Dev meme" (@devs_memes), trollface avatar and all — and yet it's a remarkably precise diagnosis of an inversion every SRE team eventually lives through. The failure mode has a name in the trenches: the observability stack became the workload.

It starts innocently. Prometheus scrapes some metrics, you add a Grafana dashboard, life is good. Then come the killers. The first is cardinality explosion: someone adds a user_id or pod_name or request_path label to a metric, and suddenly one time series becomes ten million. Prometheus keeps the index for active series in memory, so memory usage scales with cardinality — and the most darkly funny outage in the genre is Prometheus getting OOM-killed by the kernel, meaning your monitoring died of resource exhaustion and took your visibility into the resource exhaustion with it.

The second killer is scale-out. One Prometheus isn't enough, so you shard. Shards can't answer global queries, so you add federation, then Thanos or Mimir — sidecars, queriers, store gateways, compactors, object storage buckets. Each component needs its own alerts, dashboards, and capacity planning. You now operate a distributed time-series database whose operational complexity rivals the product it watches. Teams genuinely end up with meta-monitoring — a second Prometheus whose job is to alert when the first one is unhealthy — and at that point the tweet stops being hyperbole and becomes an architecture diagram.

The systemic reason this keeps happening is incentive asymmetry. Metrics are added by anyone, anytime, with one line of instrumentation code; the cost of those metrics lands months later on a platform team's bill and pager. Nobody writes a design review for a new label. Observability follows a ratchet: every incident postmortem adds "we need more metrics," none ever concludes "we should collect less." So retention grows, scrape intervals shrink, and the cluster autoscaler quietly provisions nodes whose primary occupation is remembering what the other nodes were doing. The meme's punchline is just the tail wagging the dog, stated as infrastructure policy.

Description

A dark-mode tweet from 'Dev meme' (@devs_memes) with a trollface-style avatar. The text reads: 'Prometheus was supposed to monitor your infrastructure. Now your infrastructure exists primarily to keep Prometheus running'. The joke skewers a real operational inversion: Prometheus's resource appetite (cardinality explosions, TSDB memory usage, federation layers, Thanos/Mimir sidecars) often grows until the monitoring stack consumes more engineering attention and compute than the workloads it was meant to observe

Comments

8
Anonymous ★ Top Pick We added a second Prometheus to monitor the first one; the on-call rotation now exists to acknowledge alerts about the alerting
  1. Anonymous ★ Top Pick

    We added a second Prometheus to monitor the first one; the on-call rotation now exists to acknowledge alerts about the alerting

  2. @MSYZD 4mo

    You can monitor it on another one an keep only exporters on the infrastructure 😄

    1. @TheFloofyFloof 4mo

      but how will you monitor the second infrastructure that prometheus is on?

      1. @MSYZD 4mo

        Via Zabix 😁

        1. @TheFloofyFloof 4mo

          but who monitors Zabix

          1. @MSYZD 4mo

            Unfortunately Zabix is poor It's can not have another one 😄😄😄

      2. @D13410N3 4mo

        Just have small prometheus that is monitoring your main prometheus And your main prometheus should monitor small prometheus There's a very small chance that both of them will die in one moment, i.e. if they are geo-distributed

  3. @Algoinde 4mo

    my Loki is taking up as much memory as all my other services

Use J and K for navigation