
A Statistical Case for the Golden Age of Gaming
Description
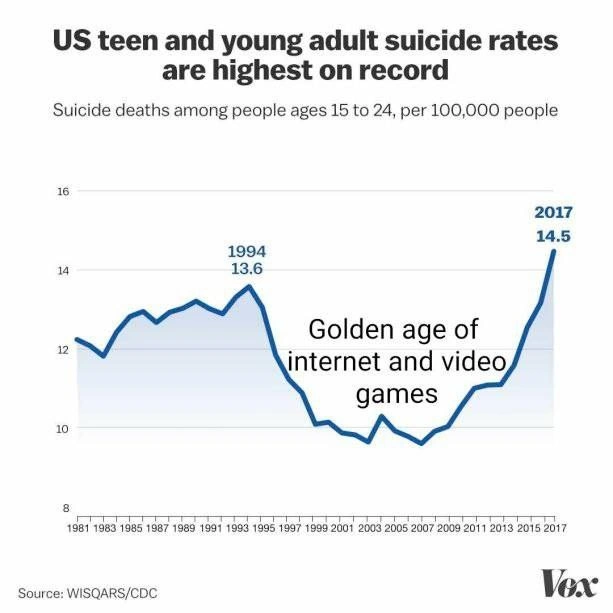
The image displays a line graph from Vox, sourced from WISQARS/CDC, titled 'US teen and young adult suicide rates are highest on record'. The chart plots suicide deaths per 100,000 people aged 15-24 from 1981 to 2017. The data shows a peak in 1994 at a rate of 13.6, followed by a significant decline into the early 2000s, and then a sharp increase to a new record high of 14.5 in 2017. A text overlay is placed over the period of decline and low rates (roughly 1997-2009), which reads, 'Golden age of internet and video games'. The meme uses a real, serious statistic to create a darkly humorous and nostalgic commentary. It ironically suggests a correlation between the era of classic online video games and a decrease in youth suicide rates, implicitly contrasting it with the subsequent rise of modern social media and its perceived negative effects on mental health. This resonates with a generation of tech professionals who grew up during that 'golden age' and often critique the current state of the internet



Comments
22Comment deleted
The data is clear: peer-to-peer connections over dedicated servers had a measurably better impact on mental health APIs than the current centralized, algorithm-driven, engagement-optimized social graph
If product wants a quick win on wellness KPIs, just cite this chart and propose Counter-Strike servers in every household - because nothing says rigorous causal inference like a convenient dip in a single time series
Ah yes, the classic 'correlation implies causation' fallacy - though as engineers who've debugged production at 3am while our Slack channels burn with incident reports, we know the real killer feature of the internet age isn't video games, it's the always-on culture and the existential dread of maintaining legacy codebases written by developers who left no documentation
Ah yes, the classic 'correlation implies whatever narrative I'm selling' fallacy. This graph beautifully demonstrates that suicide rates actually *decreased* during the supposed 'golden age' of internet and gaming, then spiked after - almost as if complex societal issues can't be reduced to 'kids these days and their screens.' It's the statistical equivalent of blaming your production outage on the intern who deployed on Friday, when really it was that technical debt from 2015 finally coming due. Senior engineers know: when your monitoring shows an inverse correlation between two metrics, maybe - just maybe - your hypothesis about causation is backwards. But hey, 'Nuanced analysis of multifactorial mental health crisis' doesn't get the same engagement as 'Video games bad,' does it?
This is why exec dashboards need causal graphs, not labels - someone’s about to open a Jira to roll back the internet to dial‑up because the time series says the KPIs will hit SLOs
The real spike hit when feeds went distributed: single-player LAN parties scaled better for sanity than infinite-scroll clusters
Annotation‑driven development: label the valley “Golden age of internet and video games” and ship causality to prod - RCT’s in the backlog
Oh, there are my people Comment deleted
why so many mfs committed suicide in 2004 Comment deleted
socioeconomic disparity Comment deleted
*wonders who will get the reference* Comment deleted
any guide for someone born after that date? Comment deleted
A furry game that has been rereleased multiple times since then Comment deleted
Ratchet & Clank (2002(?)) Comment deleted
You think that the horizontal axis here means year of death (suicide). I think it means year of birth. We are not the same. Comment deleted
Clearly admins fault for posting graph with cut-off date as 2017 Comment deleted
Oh yeah, golden era of the Top Gear production Comment deleted
I hoped that it is percentage of suiciders, but is people in 100000😢 Comment deleted
hoped? Comment deleted
If a man commits suicide, it is one less potential suicide in the future Comment deleted
that's certainly an opinion Comment deleted
It's just US Check Chinese out lol Comment deleted