Skip to content
DevMeme
4867 of 7435
The mathematical evolution of X, from linear to exponential
CS Fundamentals Post #5328, on Aug 4, 2023 in TG

The mathematical evolution of X, from linear to exponential

Why is this CS Fundamentals meme funny?

Level 1: Small, Bigger, Huge

Imagine you’re playing with building blocks. You start by laying blocks in a single line. If you have, say, 5 blocks, you get a line 5 blocks long. If you add another block, the line just gets one step longer – pretty simple growth, right? This is like the first picture with the “1”: as the number goes up, the line grows steadily. Now, let’s say you decide to make a big square shape with your blocks, like 5 rows of 5 blocks to form a 5x5 floor. To make that square a tiny bit bigger – say one block longer and one block wider (a 6x6 square) – you don’t just add 2 blocks, you have to add a whole bunch to fill the new bigger square (in fact, you’d go from 25 blocks to 36 blocks!). The amount of blocks needed blows up faster as the square gets larger because you’re filling in two dimensions. That’s like the second picture with the “2”, where the curve starts getting taller quicker – a small increase in size needs a lot more stuff.

Now for the cube. Suppose you build a little solid cube out of blocks, like a 5x5x5 cube (125 blocks total). If you wanted to make it just one block bigger in height, width, and depth (a 6x6x6 cube), you’d suddenly need a ton more blocks (216 in total) to fill the whole thing! A tiny increase in the length of each side makes the number of blocks shoot way up because now you’re filling space in three directions. That’s what the third picture with the “3” is showing – the curve goes almost straight up, meaning the quantity is growing super fast.

The joke here is that a little red number on the app (1, 2, or 3) is being treated like it’s telling us how something grows: 1 is normal growth, 2 means growing a lot faster, 3 means growing crazy fast. It’s like saying: one new message is no big deal, two is a bit more, but three at once and things start to explode! 🤯 Even if you don’t get the math, you can giggle at the idea that those notification numbers are secretly making big, curvy lines underneath. It’s a funny way to see how a small change (going from 1 to 2 to 3) can make something go from small, to big, to hugely big. In simple terms: the more powerful the number, the quicker the growth – and that’s the whole gag, using a math idea to exaggerate how much things grow as the number goes up.

Level 2: The Power of X

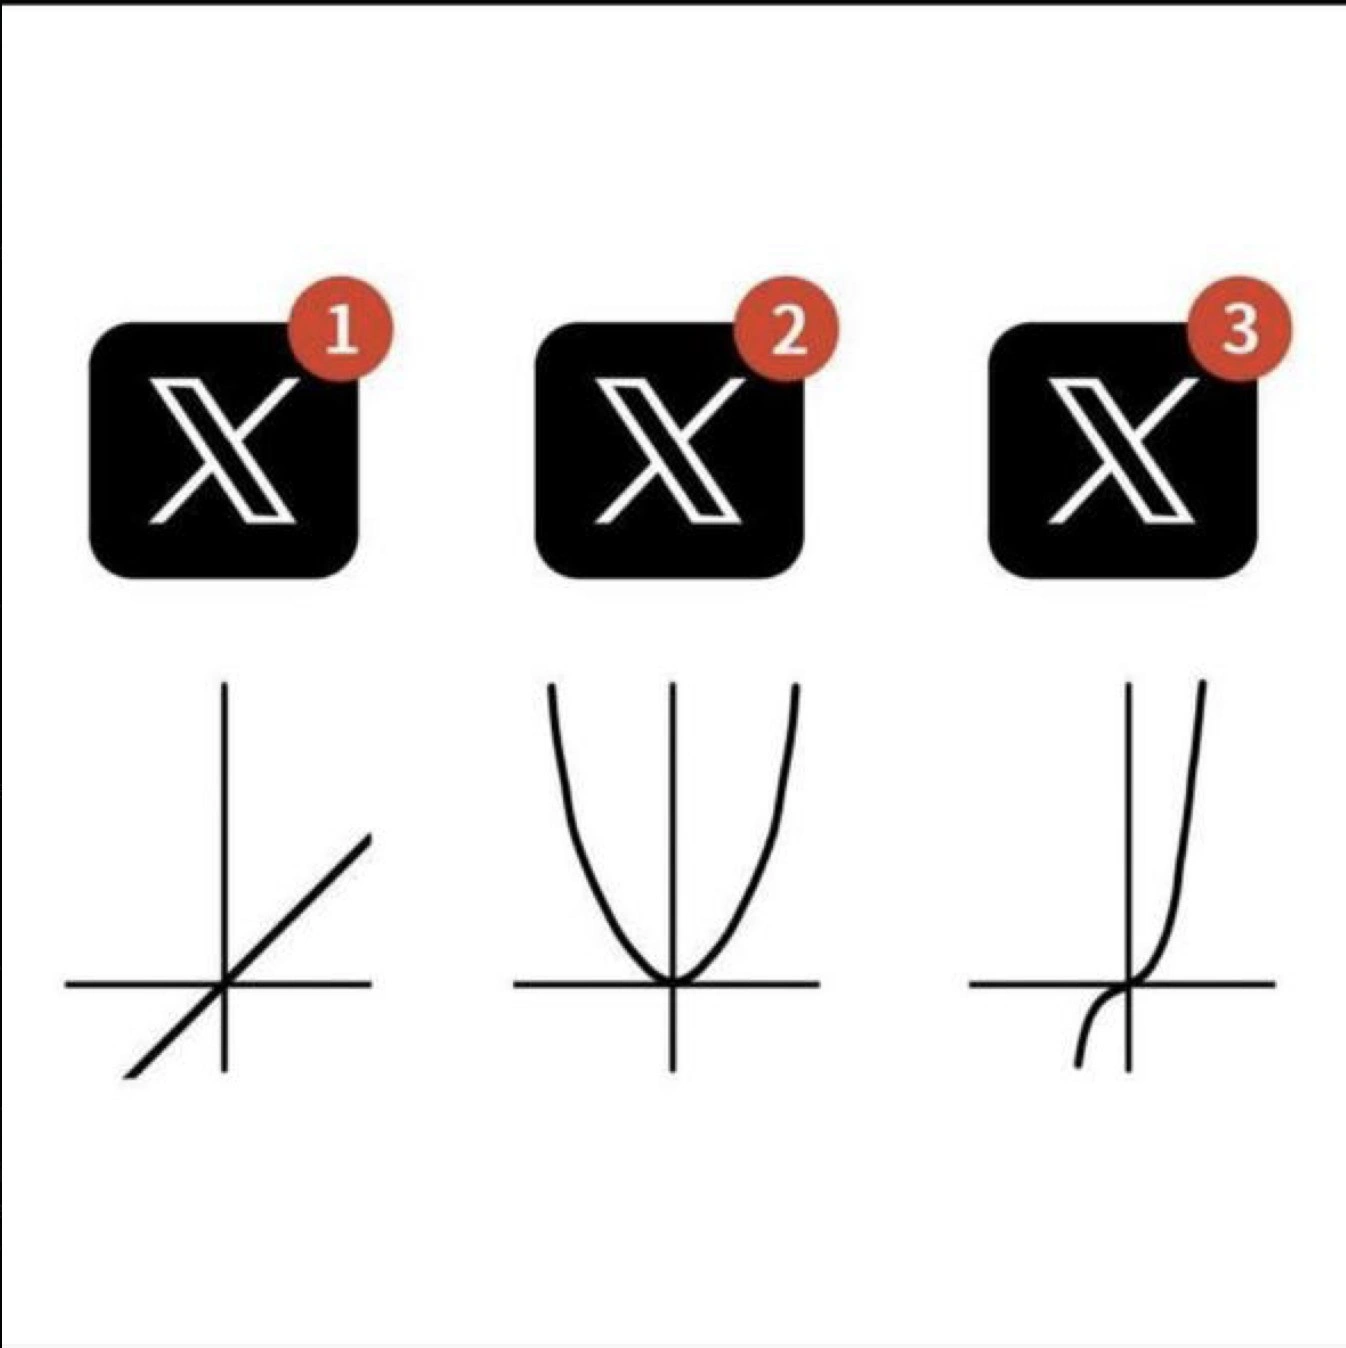
At first glance, this looks like three identical app icons with little red badges saying “1”, “2”, and “3”. That app is X (the platform formerly known as Twitter), and the red badge numbers indicate unread notifications. But here’s the twist: in math, “x” is the go-to symbol for a variable, and those tiny numbers are exponents (powers). So the meme literally reads as X¹, X², X³ – like mathematical expressions – and conveniently, it draws the matching graphs right underneath each one. Under the “1” badge we see a straight line shooting diagonally up (that’s the graph of y = x¹, a simple straight-line relationship). Under the “2”, there’s a curved ∪-shaped line (the graph of y = x², a parabola opening up). And under the “3”, the curve starts shallow then bends sharply upward (the graph of y = x³, a cubic function). Essentially, each X icon + number is being treated as “x to the power of that number,” and the plot underneath shows how that function grows as x increases. This clever layout turns a math meme into a visual pun on the app’s notification badges. 📈

Now for the computer science connection: developers often talk about how efficient (or not) an algorithm is using Big O notation. Big O uses expressions like O(n), O(n²), O(n³) to describe the time complexity of an algorithm – basically, how the amount of work grows when the input size n grows. These expressions look a lot like the math functions in the meme. And that’s no coincidence: when we say an algorithm is O(n²), we mean, roughly, its work grows proportional to n² (a quadratic curve) as n increases. The meme is literally drawing those curves for us. It’s like a quick visual cheat-sheet for linear vs. quadratic vs. cubic growth:

  • Linear – O(n): Work increases directly with n. If you double the number of things to process, it takes about twice as long. (Example: a single loop through an array of n items is linear – if n is 100, you do ~100 operations; if n is 200, ~200 operations.)
  • Quadratic – O(n²): Work increases with the square of n. If n doubles, work roughly quadruples (because 2² = 4). Common example: a double nested loop, where for every item you do a full pass on the array again (like checking every pair of items in a list). If n is 100, that could be ~100×100 = 10,000 steps; if n is 200, ~40,000 steps – growing fast!
  • Cubic – O(n³): Work grows with the cube of n. Double the input size and you get eight times the work (2³ = 8). This might happen with triple nested loops or triple-level combinations. For instance, three nested for loops that each go through n items result in on the order of n³ operations. With n = 100, that’s on the order of 1,000,000 steps; if n = 200, about 8,000,000 steps. It escalates quickly!

To make it more concrete, imagine some simple pseudocode:

// Pseudocode illustrating O(n), O(n^2), O(n^3)
printAll(items):             
    for i in items:                   // 🔹 O(n) loop 
        print(i)

printAllPairs(items):
    for i in items:                  // 🔸 O(n^2) double loop 
        for j in items:
            print(i, j)

printAllTriplets(items):
    for i in items:                  // 🔺 O(n^3) triple loop 
        for j in items:
            for k in items:
                print(i, j, k)

In the first function, if items has 5 elements, it prints 5 times (linear). The second one with two nested loops would print 25 times for 5 items (quadratic, since 5×5 = 25). The third, with three loops, would print 125 times for 5 items (cubic, 5×5×5 = 125). You can see how adding that extra loop (going from one loop, to two, to three) makes the work explode in quantity. This is exactly what those curves under the X icons are portraying: more loops (or higher exponent) = much faster growth in work. 📊

So, the meme is basically a quick lesson in algorithm complexity disguised as phone notifications. It ties into what every computer science student learns early on and every developer encounters in real life: how fast something runs can depend dramatically on the nature of its growth rate. The linear vs quadratic vs cubic comparison is a classic from CS Fundamentals. When you saw those graphs in a textbook, they might have seemed abstract, but here they’re made funny and relatable by framing them as unread messages on “X”. It’s also poking a bit of fun at the recent X rebrand – turning the app’s logo into a mathematical x. For a junior developer or someone new to these concepts, this meme is a light-hearted way to remember: one loop good, two loops careful, three loops uh-oh! 😅 It reminds us that a solution that handles 100 things in a second (linear) might choke if it naively tries to handle 10,000 things with nested loops (quadratic or cubic). In short, the power of X here is a playful nod to the powers of x in math, showing how quickly things can scale as you increase that power. It’s educational and funny at the same time – a perfect little nugget of DeveloperHumor and insight.

Level 3: Degrees of Complexity

In one witty snapshot, this meme visualizes a trifecta of algorithmic growth: linear (x¹), quadratic (x²), and cubic (x³). The black X icons aren’t just referencing the app formerly known as Twitter – they double as the algebraic variable x on a graph. Those little red notification badges with “1”, “2”, and “3” turn into exponents, so each icon reads like a function: x to the power of 1, 2, and 3. Right below, the coordinate axes confirm it with classic polynomial growth curves: a straight rising line under the “1” (that’s y = x, a first-degree polynomial), a graceful U-shaped parabola under the “2” (y = x², second-degree), and an S-shaped curve under the “3” (y = x³, third-degree). It’s a Math 101 plot lineup presented as a phone screen – a perfect mashup of TechHumor and textbook graphs.

For seasoned developers, this sight immediately screams Big O notation and algorithm complexity analysis. We’ve all grappled with how an algorithm’s run time balloons as input size (n) grows. Here, the meme’s joke is a visual reminder of exactly that: O(n) vs O(n²) vs O(n³), side by side. The humor lands because it’s so literal – the letter “X” suddenly isn’t just a brand logo, but the n in our complexity formulas! The red badge count isn't just unread notifications, it's the exponent that tells you how nasty the growth curve will be. It’s as if your app is saying, “You have 3 new notifications... and by the way, your workload just went cubic.” Experienced engineers chuckle (and maybe cringe) at this because we know that as the exponent climbs, things get dramatically harder to handle – a truth we’ve verified the hard way in production.

Let’s put that into perspective. Say n represents the number of items your code needs to process. Compare how the work scales for different complexities:

Input Size (n) Linear O(n) steps 🔹 Quadratic O(n²) steps 🔸 Cubic O(n³) steps 🔺
10 ~10 steps ~100 steps ~1,000 steps
100 ~100 steps ~10,000 steps ~1,000,000 steps
1000 ~1,000 steps ~1,000,000 steps ~1,000,000,000 steps

Even a modest increase in n turns into an explosion of work as the exponent rises. Double the input for an O(n) task, and you roughly double the operations. Double the input for an O(n²) task, and work jumps ~4×. But double n in an O(n³) routine and – yikes – you’re doing ~8× the work. The meme’s trio of curves illustrates this perfectly: linear grows at a nice steady tilt, quadratic starts curving upward faster, and cubic goes almost vertical before you know it. That steep S-curve under the “3” icon might look innocent in a diagram, but in code it’s the harbinger of slowness: think of your program grinding as it tries to execute billions of operations when n gets large. (The curve’s steepness is basically your CPU usage skyrocketing 😅.)

This juxtaposition is funny because it’s textbook math meeting real-life developer woes. It’s not every day your social media app notifications teach a lesson from CS Fundamentals. The meme is essentially a nerdy inside joke: “See these 3 new messages? That’s linear vs quadratic vs cubic complexity in action!” Developers remember those struggles – like the time a seemingly harmless nested loop turned a feature into a performance nightmare. The shared trauma of accidentally writing an O(n²) or O(n³) routine makes this depiction painfully relatable. Only in the world of DeveloperHumor do you get a notification badge doubling as a reminder of why your triple nested loop is a bad idea. In short, the image brilliantly compresses a core lesson about growth rates into a single glance. It’s the kind of joke that makes a senior dev both chuckle and instinctively mutter, “Please, not another cubic algorithm…”

Description

A three-part image that creates a visual pun by connecting the 'X' logo (formerly Twitter) to mathematical functions. The image displays three 'X' app icons, numbered 1, 2, and 3. Below icon #1 is a graph of a linear function (y=x). Below icon #2 is a graph of a quadratic function (a parabola, y=x²). Below icon #3 is a graph of an exponential or cubic function (y=x³). The joke equates the social media platform 'X' with the mathematical variable 'x', visually representing 'x', 'x squared', and 'x cubed'. For a technical audience, this is a clever reference to concepts of growth and complexity, fundamental to computer science, especially in the context of Big O notation for algorithmic performance

Comments

15
Anonymous ★ Top Pick A chart showing the growth of 'X' from a simple variable to a quadratic problem, and finally to an exponential crisis. It’s also the complexity graph for our main monolith
  1. Anonymous ★ Top Pick

    A chart showing the growth of 'X' from a simple variable to a quadratic problem, and finally to an exponential crisis. It’s also the complexity graph for our main monolith

  2. Anonymous

    Unread X pings are the perfect Big-O refresher: one alert is O(n) log checks, two escalates to O(n²) Slack threads, the third goes O(n³) war-room tabs - and execs still ask why MTTR isn’t constant time

  3. Anonymous

    Just like our production incidents, X notifications follow the same trajectory: starts linear during the honeymoon phase, goes quadratic when the API rate limits kick in, then exponential right before the platform implodes - though at least our Kubernetes clusters have better uptime than their verification system

  4. Anonymous

    When your notification count scales polynomially, you know you've either gone viral or your monitoring alerts are experiencing O(n³) growth - either way, time to implement exponential backoff before your inbox achieves singularity

  5. Anonymous

    Treat X badges as complexity classes: 1 is linear noise, 2 is quadratic distraction, and 3 is cubic context-switch thrashing that starves every thread of focus

  6. Anonymous

    X notifications for devs: O(n) lurking, O(n³) after one hot take on Kubernetes operators

  7. Anonymous

    On X the red badge isn’t unread count, it’s the exponent on algorithmic pain: 1 is linear, 2 quadratic, 3 cubic - ask for a 4th and your cloud bill draws the rest of the curve

  8. @ZgGPuo8dZef58K6hxxGVj3Z2 2y

    LMAO

  9. @SomeWhereIBelong 2y

    Took me a bit to get it

    1. @KP2020 2y

      What

      1. @ZgGPuo8dZef58K6hxxGVj3Z2 2y

        It’s math graphs x^1, x^2, x^3.

  10. @CasteNico 2y

    x^0 is missing

    1. @SamsonovAnton 2y

      Flat line means your social life is over.

  11. @azizhakberdiev 2y

    my mail spam inbox draws Taylor series

  12. @H8cker71 2y

    lmao

Use J and K for navigation