Valgrind gives up after logging 10,000,000 memory errors in your C app
Why is this Bugs meme funny?
Level 1: Too Many Mistakes to Count
Imagine writing a school essay with so many errors that your teacher starts correcting them but then just gives up and says, “This has way too many mistakes – please redo it from scratch.” In this meme, the same kind of thing happens but with a computer program. The program made so many mistakes that the tool supposed to check it finally stopped and told the programmer to fix the whole thing. It’s funny because we expect computers to be tireless and exact, but here even the computer is basically saying “I can’t even keep up with this!” That moment when the helper quits on the job makes us laugh – it’s an extreme way to show just how wildly wrong the code went.
Level 2: Memory Mayhem
Let’s break down what’s happening in simpler terms. Valgrind is a popular debugging tool used with C and C++ (the C family of languages). It helps catch memory-related bugs by running your program in a special mode that watches every memory operation. In these low-level languages, you manually manage memory (you allocate and free it yourself), which is powerful but error-prone. Common mistakes include forgetting to free memory (memory leaks), writing past the end of an array (buffer overflow), or using memory after you’ve freed it (dangling pointer). These issues cause runtime errors – your program might crash or glitch in strange ways, or even silently corrupt data.
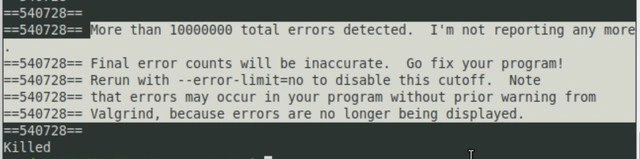
Valgrind’s job (when using its Memcheck tool) is to log each bad memory access so you can see what went wrong. For example, if your code writes outside the bounds of an array, Valgrind will print an error message about an “invalid write.” If that happens 10 times, it’ll log 10 errors. The meme’s terminal screenshot shows Valgrind hitting an internal error limit because the program went absolutely haywire, basically overloading the poor tool. It detected more than ten million mistakes! At that point, Valgrind stops detailing each one and effectively says “I’ve reported enough; this is too much. Please go fix your code.”
To illustrate how one bug can cause an explosion of errors, look at this tiny C program:
#include <stdlib.h>
#include <stdio.h>
int main() {
int *numbers = malloc(5 * sizeof(int));
// Intentionally write beyond the allocated array size:
for (int i = 0; i < 10000000; ++i) {
numbers[i] = 42; // out-of-bounds write after index 4
}
free(numbers);
return 0;
}
Here, we only allocated space for 5 integers, but the loop writes to numbers[0] through numbers[9999999]. Everything after index 4 is writing into memory that wasn’t allocated (a big no-no). If you run this program normally, it will likely crash with a segmentation fault as soon as it writes into off-limits memory. But if you run it under Valgrind, Valgrind will catch each out-of-bounds write as it happens instead of letting the program die immediately. It would produce an error for index 5, 6, 7, and so on, potentially all the way up to index 9,999,999 (if the program doesn’t crash earlier). That’s millions of errors being caught in one run!
Of course, Valgrind won’t actually print millions of lines without end – it has that built-in cutoff. By default, once it logs 10,000,000 errors, it stops reporting further ones. That’s why the message says “I’m not reporting any more.” It even suggests you can run with --error-limit=no to disable the cutoff (meaning it would try to report everything), but at that stage more messages wouldn’t really help. Essentially, the tool is telling you that the program is so far gone that listing every single error is pointless – you need to go back and fix the bug causing the chaos.
This situation is like the final boss of debugging and troubleshooting a C program. It shows how a tiny mistake in low-level programming can snowball into a huge problem. In higher-level languages (like Python or Java), you’d usually get a single error and the program would stop. But C lets you continue running even after a mistake, which is why you can end up with insanity like millions of errors. That’s also why tools like Valgrind are lifesavers: they catch these mistakes that the program itself doesn’t catch. When Valgrind basically gives up, it’s a loud-and-clear signal that something is really broken. Even memory leaks (when you forget to free memory) look mild compared to this — a leak might slowly waste memory, but writing out of bounds can make a program act unpredictably or crash. This meme is funny in a “so bad it’s hilarious” way. It exaggerates just how disastrously things can fail if you mess up memory management in C, to the point that even the error checker throws up its hands and says “enough!”
Level 3: Valgrind’s White Flag
Even battle-hardened C/C++ developers do a double-take when their debugging tool essentially tells them “I quit.” This scenario is a mix of horror and dark humor: the program is so broken that even Valgrind – a tool whose sole purpose is to detect bugs – gives up reporting them. When you see Valgrind print a blunt admonition like:
"More than 10000000 total errors detected. I’m not reporting any more... Go fix your program!"
you know you’ve crossed into absurd territory. It’s the ultimate facepalm moment in low-level programming: a bug so prolific that the tool meant to help you throws up its hands. At that point, a seasoned engineer will likely stop the test on the spot (there’s little sense in wading through millions of error logs) and switch into full-on debugging mode to hunt down the root cause.
What kind of mistake produces 10^7+ memory errors? Almost always, it’s a single runaway bug that snowballs into a colossal mess. Some usual suspects are:
- Off-by-one loop bug – iterating past an array’s end in a loop, generating an invalid write on every iteration.
- Use-after-free frenzy – freeing a buffer but then continuing to use that now dangling pointer repeatedly, so each use is an illegal memory access.
- Wild pointer rampage – an uninitialized or wild pointer that points who-knows-where, and a loop or routine writes through it, corrupting a new location each time.
No ordinary memory bug yields millions of distinct errors; this is a full-blown memory meltdown. By the time you hit error number 10,000,000, the heap is basically on fire. Seasoned devs know that reading beyond the first few error messages is futile – the signal-to-noise ratio drops to nil when everything is broken. Instead, you’d use those initial reports as clues and quickly zero in on the one catastrophic mistake in the code. (Fixing a single faulty loop index or pointer arithmetic bug can literally eliminate all those errors in one go!) The final “Killed” in the screenshot drives home that the program (or Valgrind itself) couldn’t carry on – either it crashed under the weight of the chaos or was mercifully terminated. From a debugging and troubleshooting standpoint, it’s a clear sign that it’s time to roll up your sleeves and repair the code, not just collect more logs.
There’s a camaraderie among developers who’ve wrestled with bugs like this. It’s the kind of war story you share over coffee: “Remember that time I ran Valgrind and it begged for mercy?” Everyone winces and laughs because they know low-level programming can go off the rails in spectacular ways. In safer languages (like Python, Java, or even modern C++ with smart pointers), you’d typically get a single error or exception and then execution stops. But in C, if you stray out of bounds, the program will plow ahead into oblivion until something external intervenes (a segfault, an OS kill, or Valgrind throwing up its hands). That dynamic – the freedom and danger of manual memory management – is exactly why this meme hits home. It reminds the experienced folks of just how wild things can get when a simple oversight unleashes unchecked undefined behavior at scale. The humor softens the horror: if you don’t laugh, you might just cry at the sight of a tool saying “go fix your program!”
Level 4: Undefined Behavior Event Horizon
At the extreme technical end, this meme highlights a fundamental truth about undefined behavior in low-level programming: it can be practically unbounded. Tools like Valgrind (specifically its Memcheck tool) operate using dynamic binary instrumentation – essentially running your program on a virtual CPU and checking every memory operation against a shadow memory model. For each byte of real memory, Memcheck maintains metadata (in a “shadow” space) marking whether that byte is allocated, freed, or uninitialized. So when your C app goes rogue – say by writing to memory that was never allocated or already freed – Valgrind can catch it in the act, flagging an error on the spot.
However, even this meticulous runtime checking has its limits. If a program enters a pathological state where it triggers millions of memory faults (for example, writing past an array boundary in a long loop), the error reporting becomes a flood. Every invalid access tries to increment Valgrind’s internal counters and print a warning. In computational complexity terms, it’s like hitting an infinite loop of faults: you’ve effectively created a situation where the tool would produce an endless stream of error events. This is reminiscent of theoretical limits in program analysis – fully verifying memory safety in arbitrary programs is as hard as solving the Halting Problem, so practical tools must draw a line somewhere.
That’s why Valgrind imposes a default error limit (here, 10,000,000 errors). This cutoff is a pragmatic failsafe: without it, the overhead of logging errors could itself crash or stall the analysis. Each error record consumes time and memory; beyond a certain point, the deluge of reports stops being useful and starts hindering execution. The message hinting to “rerun with --error-limit=no to disable this cutoff” acknowledges that yes, you could let the errors continue unabated – but doing so might be futile. In fact, the ominous “Killed” at the end of the output likely indicates the operating system stepped in (perhaps the process exhausted RAM or the user manually terminated it) once the avalanche of errors grew out of control.
In essence, Valgrind’s designers built in a kind of event horizon for errors: cross the 10-million mistake mark, and the tool stops observing further, treating the state beyond as a chaotic singularity of memory corruption. Even powerful debugging instruments have to say “enough” when faced with a runaway program devouring its own heap.
Description
Terminal screenshot with a dark-on-light theme shows Valgrind output. Lines read: "==540728== More than 10000000 total errors detected. I'm not reporting any more" followed by "==540728== Final error counts will be inaccurate. Go fix your program!", "==540728== Rerun with --error-limit=no to disable this cutoff. Note", "==540728== that errors may occur in your program without prior warning from", "==540728== Valgrind, because errors are no longer being displayed." The last shell prompt simply says "Killed." The image captures the moment a memory-debugging tool rate-limits itself, a scenario familiar to seasoned C/C++ engineers who have accidentally sprayed the heap with unchecked writes or wild pointers. It humorously highlights the sheer scale of undefined behavior possible in low-level systems programming and the futility of continuing execution when tooling itself taps out

Comments
7Comment deleted
When your malloc audit is so bad that even Valgrind introduces its own rate-limiter, it’s less a bug report and more a distributed denial-of-sanity
When Valgrind stops counting at 10 million errors, you're not debugging anymore - you're conducting an archaeological excavation of every memory management sin committed since malloc was invented
When even Valgrind rage-quits with 'Go fix your program!', that's not a diagnostic anymore - that's a performance review
When Valgrind hits 10 million errors and just gives up, you know you've achieved something truly special. It's like getting a participation trophy for writing the most creative ways to corrupt memory. At this point, the real question isn't 'what's wrong with my code?' but rather 'what's right with it?' - and the answer is probably 'the #include statements.' This is the software equivalent of a building inspector walking into a house, seeing every wall is load-bearing drywall held up by duct tape, and just quietly backing out while updating their resume
Valgrind's white flag: '10M leaks detected - nuke from orbit, it's the only way to be sure.'
Your malloc/free mismatch is so egregious Valgrind introduced error budgets, and Linux's OOM killer did the final code review
Valgrind taps out at 10,000,000 errors and the kernel says “Killed” - when the bug can DoS your tooling, it’s not a memory leak, it’s an architecture choice