Skip to content
DevMeme
6424 of 7435
Vibe Coding Graph: Progress, Complexity, and Happiness Over Time
TechDebt Post #7045, on Aug 15, 2025 in TG

Vibe Coding Graph: Progress, Complexity, and Happiness Over Time

Why is this TechDebt meme funny?

Level 1: Emotional Rollercoaster

Imagine you and your friends decide to build the tallest LEGO tower you can. At the start, it’s super fun and easy. You quickly snap together a strong base and the tower shoots up fast – you’re making amazing progress and everyone is excited, laughing, and having a great time. This is like the beginning of a project when everything is new and simple. Your LEGO structure isn’t complicated yet (low complexity), so adding each new layer is quick. You feel happy because you see the tower growing taller by the minute. This happy, productive early time is what the meme calls the “vibe zone” – it’s all good vibes and smooth sailing.

Now pretend your tower keeps getting higher and higher. As it grows, you start noticing it’s a bit wobbly and not so simple to add new pieces anymore. You have to be careful placing each block. It might take a couple of tries to fit a new piece without knocking others over. The higher it gets, the more complicated and unstable the tower becomes. Maybe you realize the base wasn’t built to support so many levels, and you’ve been kind of building on the fly. This is like the project getting more complex – the equivalent of that orange line rising in the meme. What about your feelings? Well, you’re probably not as happy as at the start. You might be a little anxious each time you add a piece, hoping the whole thing doesn’t crash. Maybe you’re even frustrated that it’s taking so long just to add one more section. That initial excitement has worn off because things have become tricky. In the meme, that’s the blue happiness line coming down. By the time you’re nearing the limit of how high you can go, you might be balancing pieces on top ever so slowly, holding your breath – the fun has really gone away, and now it’s more like hard work or stress.

In the end, our LEGO tower analogy shows the same roller-coaster of emotions. Starting out, you were thrilled (high happiness) and making great progress with little effort (low complexity). But as the tower grew (project got larger), it became harder to manage (higher complexity) and each new addition was stressful (low happiness). The funny-sad truth that the meme captures is: what begins as an easy, happy adventure can turn into a difficult, draining challenge as things get more complicated. Anyone who’s tried to do something big – whether it’s a school assignment, a DIY project, or coding a new app – has felt this. At first it’s “Yay, this is going great!” and later it’s “Oh no, what did I get myself into?”. The meme just sums it up with a simple picture: progress going up then flattening, complexity staying low then shooting up, and happiness eventually sliding down. It’s a little rollercoaster ride, and we can all nod and laugh because we’ve been on it at some point.

Level 2: Fast Start, Bumpy Ride

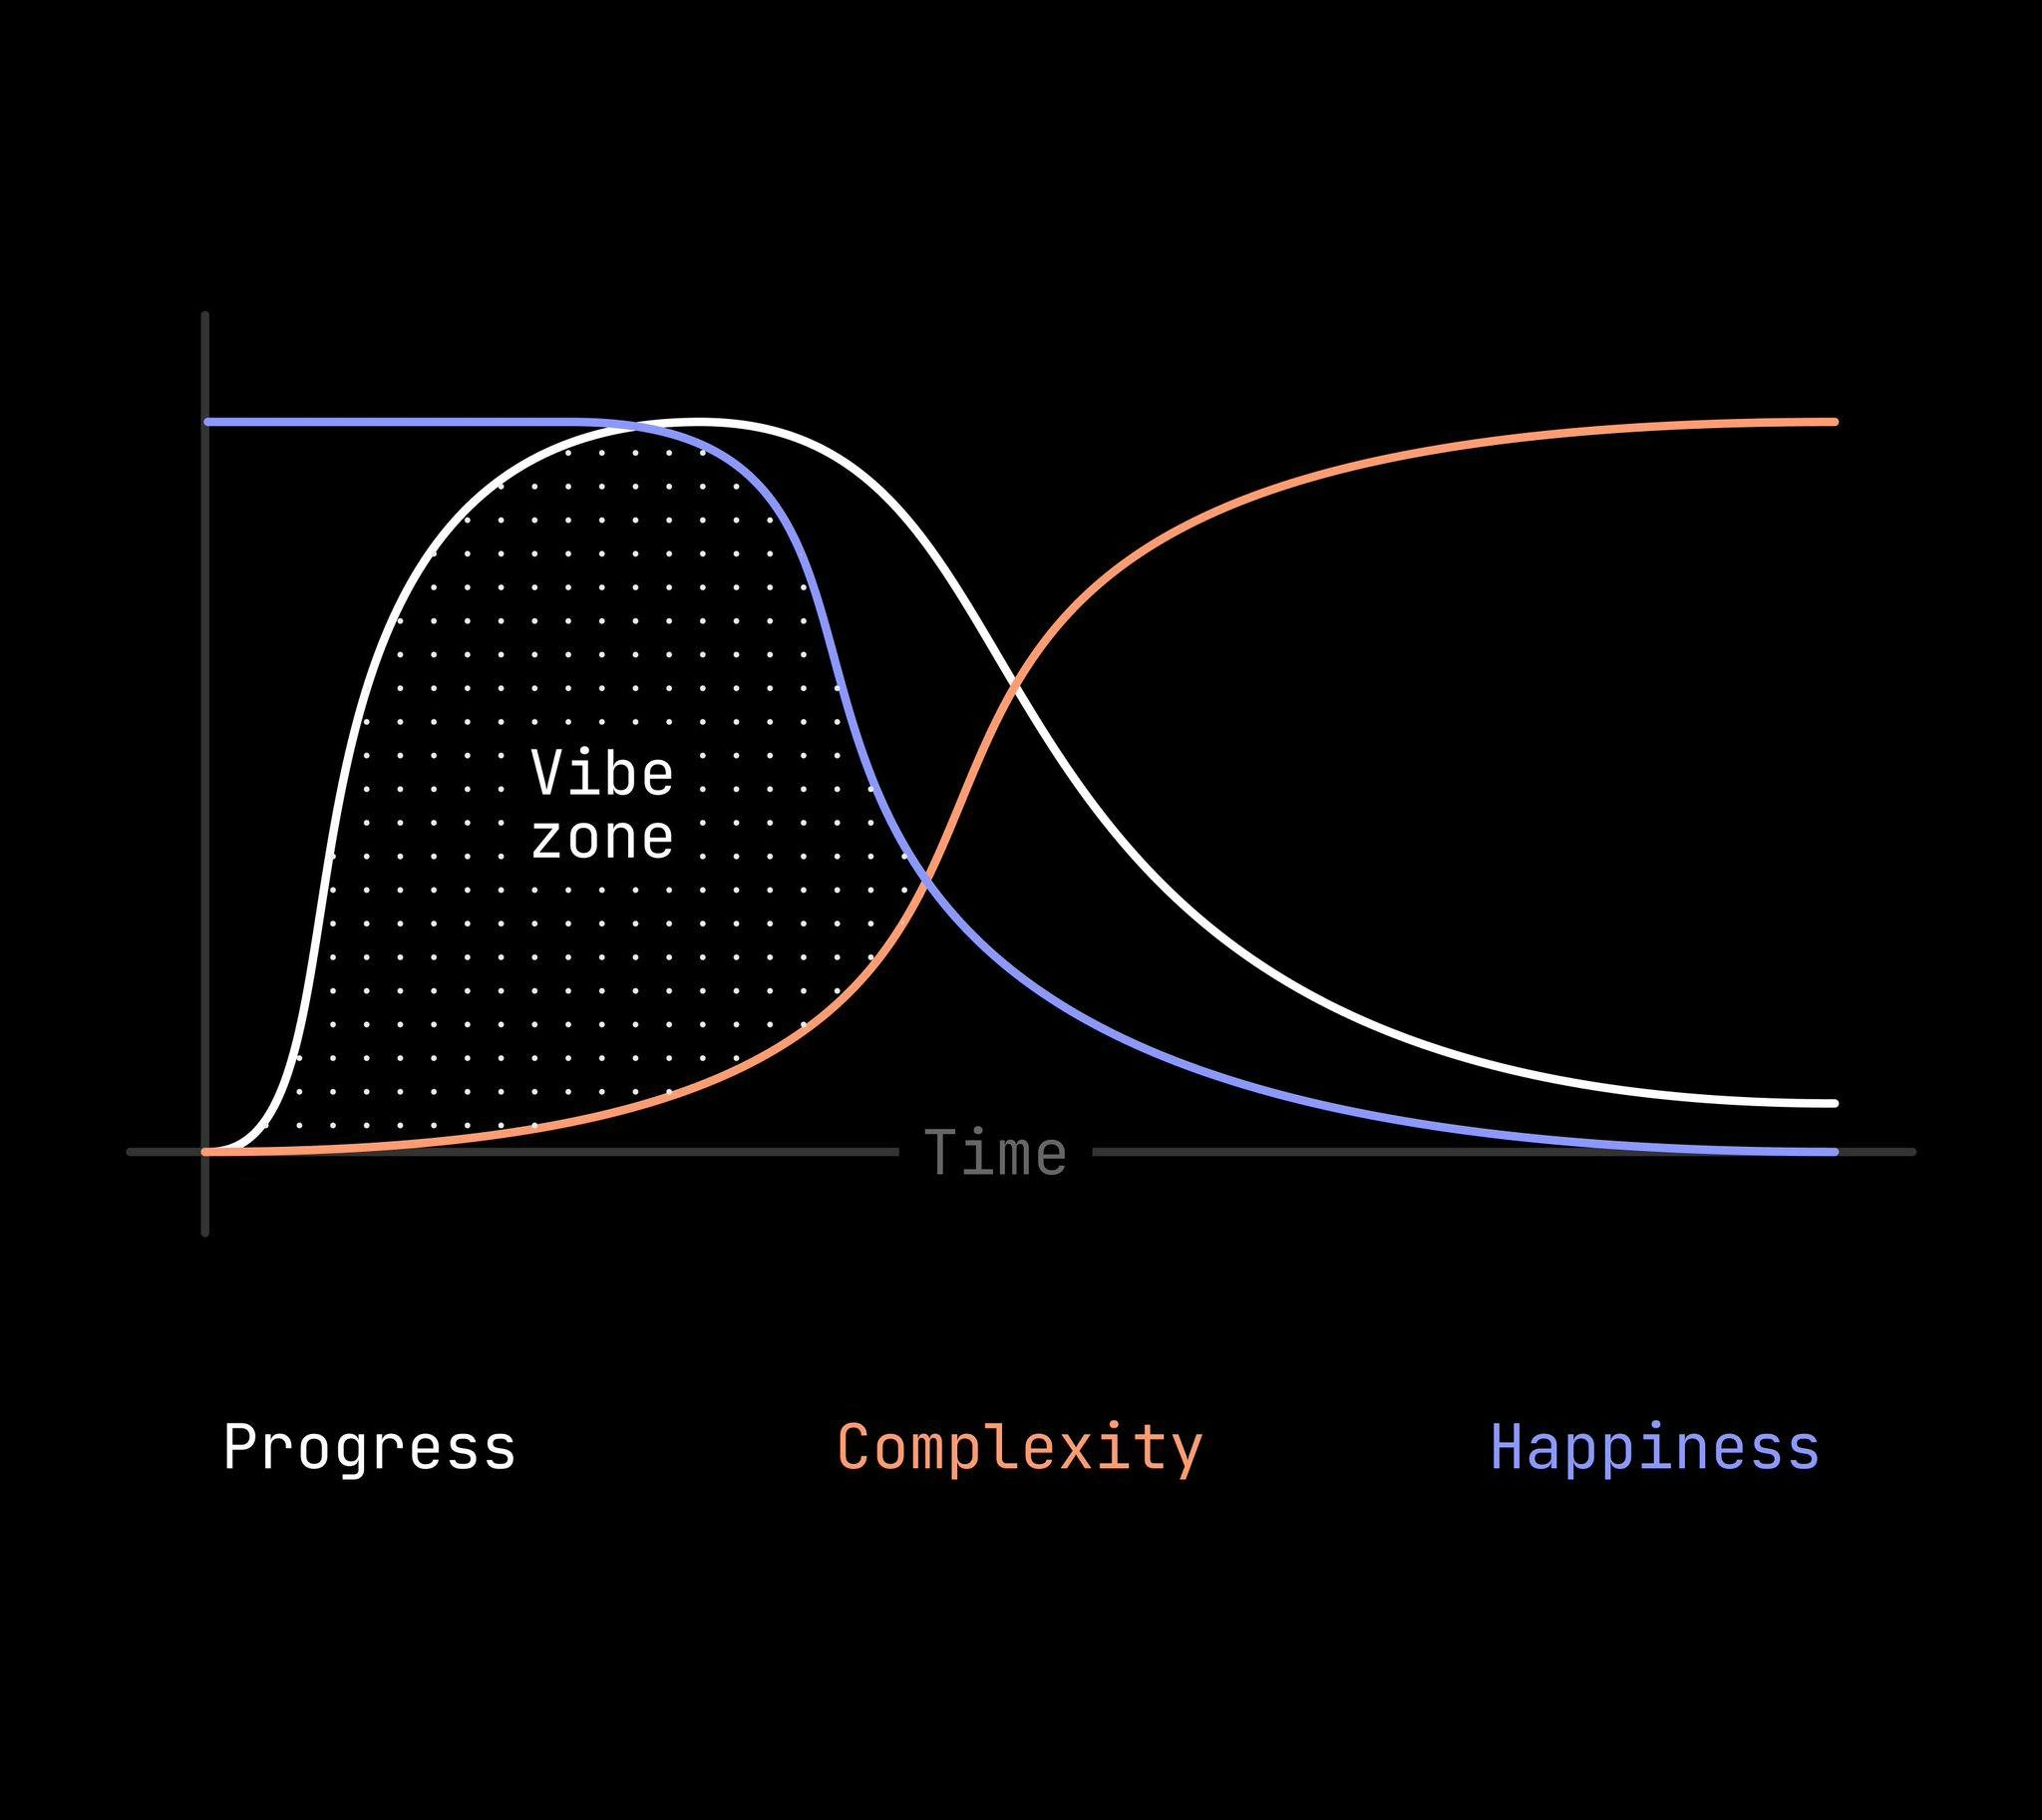
Let’s break this down in simpler, real-world terms. This meme’s chart is showing how a typical software project feels over time, especially for developers. In the beginning of a new project (we call this a greenfield project, meaning you’re starting from scratch with no existing code), everything is fresh and exciting. The team can move really fast. Think of the white Progress line on the graph: it shoots up at the start because the developers are building features quickly. For example, if it’s a new app, maybe in the first week you get user login, a homepage, and a couple of core features all done – bam! Progress is high, and it looks almost vertical on the chart. During this time, the orange Complexity line in the graph stays really low, near the bottom. Low complexity means the system (the code and design) is still simple and easy to understand. With only a few components and not much interlocking logic, there’s not much that can go wrong. The code is small enough that one person can grasp the whole thing, so fixing or adding things is straightforward. This early phase is often called the “vibe zone” (as labeled on the chart with dotted shading) because the team’s vibes – their morale and confidence – are great. Everyone is happy, productive, and maybe a bit over-optimistic about how easy this project will be. The blue Happiness line starts high on the left side of the graph to reflect that the developers are feeling good. High progress + low complexity = smiling team.

Now, as time goes on, more features get added. The project grows beyond that initial prototype. Perhaps some scope creep happens – that’s when new requirements or feature ideas keep sneaking in beyond what was originally planned. (It’s like when you plan to build a simple blog site, and then someone says, “Can we also add a shopping cart? And a forum? And maybe real-time chat?” Suddenly the scope of the project creeps larger and larger.) With each new addition, the codebase becomes a bit more complicated. You have more files, more functions, maybe more integration between parts of the system. The Complexity (orange line) starts to rise noticeably. It might not be a problem at first – a little complexity is natural – but if the team isn’t careful, it can accelerate. For instance, if the code was written very quickly initially, there might be some messy parts (we call this technical debt). Technical debt is like taking shortcuts in code: you get things done faster today, but you owe the codebase some fixes and cleanup later. It’s similar to skipping homework – you save time now, but pay for it later when you don’t understand the material. As more features pile on, these messy parts can make adding the next feature harder.

So, on our graph mid-way through, the white Progress line isn’t so steep anymore – it starts to flatten out. That represents the team slowing down a bit. For example, earlier a new feature took one day, but now a similarly small-sounding feature might take several days or a week. Why? Because the developers have to navigate around existing code, making sure they don’t break anything that’s already there. Maybe they spend time refactoring (reworking old code) or writing more tests. Meanwhile, the Happiness (blue line) of the team might start dropping. It’s not that the developers suddenly became grumpy people; it’s that their day-to-day job got more frustrating. Imagine getting stuck in long debugging sessions because two parts of the app interact in an unexpected way – that can be pretty demoralizing. On the chart, that’s the blue line curving downward after the midpoint, showing the decline in morale.

Eventually, the graph shows the orange Complexity line climbing above both the progress line and the happiness line. This crossing point is essentially the moment when the project’s complexity outweighs the development progress and the developers’ enjoyment. In practical terms, it’s when the team feels like they’re spending more time dealing with complexity (untangling weird bugs, figuring out confusing code, coordinating fixes) than they are delivering new value. It can feel like running in place or even backwards. An example scenario: adding a simple profile page breaks the login feature, because of some unforeseen connection in the code – now you have two problems to fix before you can move on. Progress nearly stalls (white line flat) because so much effort goes into solving issues rather than adding cool new things. Developer happiness (blue line) might hit rock bottom here; nobody likes feeling unproductive or like they’re stuck in a quagmire of their own making. If you’ve ever worked on a school coding assignment or personal project that got out-of-hand with too many features, you might have felt a bit of this – where each change causes problems somewhere else, and it stops being fun.

To paint a clear picture, consider a concrete example: say you’re building a simple to-do list app as a beginner. On Day 1, you get the basic feature working: you can add tasks and check them off. Great progress, and the code is maybe just one or two files – super easy to read and modify (low complexity). You’re happy with it. Then you decide to add categories, then user accounts, then syncing across devices, and maybe a feature to share tasks with friends. By Day 30, your little app now has dozens of source files, and many functions depend on each other. Perhaps you rushed some of these features without fully thinking them through (hello, technical debt). Now, when you try to change how the syncing works, you accidentally break the sharing feature because they were using some of the same code in a not-so-obvious way. You spend hours debugging a problem that didn’t exist before. That’s complexity catching up. Your progress on new features slows down dramatically because you’re spending so much time fixing and maintaining what’s already there. And your happiness? You might start feeling a bit frustrated or discouraged, whereas in the beginning you felt on top of the world.

The key terms from the meme – Progress, Complexity, and Happiness – thus tell a little story of a project. Early on, Progress is high and Complexity is low, which means developer Happiness is high. Later, Complexity becomes high, Progress slows down, and developer Happiness drops. This is a common pattern in the project_lifecycle_curve of software if the team doesn’t continuously manage the complexity. The meme is relatable because it condenses that whole story into a simple graph that any developer with a bit of experience will recognize. It’s basically saying, “Look, we’ve all seen how a project that starts smooth can turn into a struggle over time.” For a newer developer or someone not in software, it’s a quick visual lesson: building things quickly is fun at first, but if you don’t keep the system clean and under control, it gets harder and less fun as you go on.

Level 3: The Vibe Zone Trap

In day-to-day software development, this meme nails a scenario every senior engineer finds painfully familiar. Picture the start of a greenfield project – you have a fresh repo, no legacy code holding you back, and all the early_project_optimism in the world. In those first few weeks, the team is cranking out features at light speed. The codebase is small enough to hold in your head, so introducing a new feature or a change is straightforward. That’s the blissful region highlighted as the “Vibe zone” on the chart (the dotted area under the white and orange lines early on). The white Progress line rockets upward here because each commit delivers visible value. DeveloperProductivity is through the roof. You might even deploy new features multiple times a day. And notice, the orange Complexity line is flat near zero initially – the system’s design is still coherent, there’s basically zero tangled dependencies. Everything is simple. It’s the honeymoon phase of the SDLC (Software Development Life Cycle), and the whole team’s DeveloperExperience (DX) feels fantastic. People are high-fiving over rapid releases, management is thrilled, and the code feels like a well-organized little garden. This is the trap.

Why a trap? Because early success can blind you to the creeping TechnicalDebt and scope creep that are often just around the corner. In the throes of that early momentum (the vibe), it’s easy to say “yes” to every new feature request – after all, everything seems so easy to build! Maybe you even take a few shortcuts to keep the pace up: hard-coding a logic here, skipping tests there, postponing that refactor you know you should do. “We’ll clean it up later,” you tell yourself during the vibe zone. Spoiler: “later” never comes without a cost. Each of those tiny shortcuts is like swiping a little on the company credit card – you’re racking up a balance of technical debt, even as progress stays high. And for a while, it’s fine. The blue Happiness line is at its peak: developers are proud of how much they’re shipping and maybe a bit intoxicated by the praise from demo days. The architecture still feels okay, even if a few corners were cut. In fact, everyone’s having such a good time that hardly anyone notices the orange complexity curve inching upwards from the baseline.

Then the project grows a bit more. Requirements start getting more complex, and perhaps less clear. You realize that some earlier decisions weren’t future-proof. New features must contort to fit into the old structures. That once-flat complexity line starts curling upward like a sinister grin. Scope creep kicks in: “Since you built feature X so quickly, can we also have Y and Z by next month?” Management, riding high on the early progress, keeps feeding the team more work. Suddenly, integrating feature Y isn’t so straightforward – it interacts weirdly with X. You get your first taste of unexpected bugs and longer debugging sessions. Progress (white line) begins to slow down, approaching that plateau. The team’s velocity (amount of work done per sprint) drops, surprising everyone who remembers the good old vibe days. Maybe a couple of deadlines slip.

By the time the orange complexity line intersects the white progress line, the project has entered the “uh-oh” zone. This is the moment where adding new code yields diminishing (or zero) returns because so much effort goes into wrestling with the existing complexity. Engineers spend more time reading and untangling code than writing new features. You might hear comments like, “Why is adding this simple checkbox taking all day?!” The truth is, there’s no such thing as a “simple” change anymore – every part of the system is now connected to multiple other parts, often in non-obvious ways. The codebase might have evolved into what’s jokingly called a big ball of mud architecture: indistinct boundaries, lots of interdependencies, and perhaps a whole bunch of spaghetti spaghetti code where quick fixes and patches have piled up. To put it in meme terms: the vibe is officially dead.

Not coincidentally, it’s around this point that the blue Happiness line starts its dive toward the x-axis (toward zero). Developer enthusiasm turns into DeveloperExhaustion. Features that once took an hour now take a week of careful surgery on the code. Each new bug fix seems to introduce two new bugs (the hydra effect of a messy system). Merging someone else’s changes triggers merge conflicts every time. Stand-up meetings go from “Yesterday I built X, today I’ll add Y” to “Yesterday I fought with X, today I’m still fighting with X.” The team that was once celebrating is now asking questions like, “Should we consider refactoring or even rewriting this thing?” – which is basically developer-speak for “How did we get here?”. It’s at this low point that you often see morale hit rock bottom. Folks who were so excited to join the project early on now sigh heavily when a new feature request comes down the pipe, because they know it’s not a fun little add – it’s a Jenga move in a teetering tower of code.

The humor of the meme comes from this progress_vs_complexity_tradeoff being drawn so starkly. It’s funny because it’s true. Every experienced dev has lived through that transition from the vibe zone into the grind zone. We laugh (maybe a bit bitterly) seeing it graphed: the white line climbing then flatlining, the orange line doing a takeover, and happiness getting squeezed out. It’s an exaggerated cartoon, sure, but not by much! The happiness_decay in real projects may not be literally plotted, but you can feel it in the team’s mood. This graph is basically the unofficial portrait of long-term software development projects: start with a celebration, end with a support group.

Importantly, the meme carries an implicit warning. Unchecked complexity is the killer of developer productivity and joy. It’s telling us that those early decisions and technical debt add up. There’s a reason good teams insist on things like code reviews, refactoring, and saying “no” to certain features – they’re trying to prolong the vibe zone and push out that crossover point where complexity overtakes progress. But of course, in real life, business pressures, tight deadlines, and human nature often lead us straight into the trap anyway. As a result, many projects eventually hit that wall where building new stuff halts until a major cleanup (or system rewrite) happens. Senior engineers swap war stories about “that one project that was awesome for six months and then became a maintenance nightmare.” Some even preemptively joke, “Enjoy the vibe zone while it lasts, folks,” at kickoff meetings. They know the roller-coaster is about to go downhill.

In summary, the meme strikes a chord because it captures a nearly universal trajectory in dev work. It reassures those who’ve been through it that they’re not alone (and maybe prods them to do things differently next time), and it gently educates newcomers that software projects aren’t all sunshine and greenfield glory. There’s a twist in the plot, and it’s called Complexity, the great equalizer. The vibe zone is awesome, but it doesn’t last by accident – you have to work to keep complexity in check, or you’ll ride the same roller-coaster every time. And trust me, cleaning up that big ball of mud at 3 AM when something finally breaks for real? That’s the part of the ride nobody enjoys.

Level 4: Entropy Always Wins

At the most theoretical level, this meme echoes a fundamental principle of software engineering: complexity naturally increases over time – a bit like a code-specific version of the second law of thermodynamics. In academic terms, it’s a nod to Lehman's Second Law of Software Evolution, which observes that a system’s complexity will increase unless active efforts are made to reduce it. In other words, given a long enough timeline (and enough features), any large codebase tends toward chaos by default. Early on, a new system enjoys low entropy: everything is clean, isolated, and understandable. This is the honeymoon period (the vibe zone shown under those curves) where all the essential complexity of the problem is still manageable and accidental complexity (the stuff we developers add on top) is minimal. Progress (the white curve) can soar almost unimpeded because there are few entanglements – adding one more function or microservice doesn’t require untangling five others. It’s as if the project is in a low-gravity environment where moving objects (features) is effortless.

However, as the system grows, each new feature or change introduces more interactions and edge cases. This is analogous to increasing entropy in a closed system: disorder accumulates unless energy is expended to organize it. Classes start depending on one another in unpredictable ways, modules multiply, and that once elegant architecture starts looking like a plate of spaghetti. The complexity curve (orange) in the meme shoots upward, reflecting this compounding effect. In theoretical terms, one could say the system’s state space is growing non-linearly – the number of ways things can go wrong increases combinatorially as components intertwine. There’s even a phase transition of sorts: beyond a critical point of complexity, the behavior of the project’s progress and morale fundamentally changes. It stops behaving like a tidy linear system and more like a chaotic one, where small changes have big, unpredictable consequences (hello, heisenbugs!).

We can try to model the relationship semi-formally. Suppose we imagine developer happiness $H$ as inversely related to system complexity $C$. A toy model might be:

$$ H = \frac{H_{0}}{1 + \alpha , C}, $$

where $H_{0}$ is the initial happiness (when $C \approx 0$) and $\alpha$ is some constant factor of pain per complexity unit. As $C$ grows, $H$ decays towards zero – exactly as the meme’s blue happiness line depicts. Meanwhile, Progress might follow a diminishing returns curve (think of it like an S-curve or logistic growth). Initially, progress is nearly exponential (the steep climb of the white line) because each added module provides a lot of new value. But as complexity rises, progress slows and plateaus – you hit an asymptote where adding more code yields negligible forward movement (or even negative returns when you spend all day fixing regressions). In Big O notation style humor, one might quip that the complexity of adding new features grows from O(1) to O(n^2) as the codebase size $n$ increases, because now any change impacts many parts. The crossing point in the graph – where the orange Complexity line overtakes the white Progress line and the blue Happiness line – is essentially the tipping point. Past that, the project enters a high-entropy state where chaos (bugs, unpredictable interactions, lengthy debugging sessions) dominates output. This is the Complexity Singularity: the moment after which adding more code actually makes things worse for the developers.

It’s darkly funny because it’s true. Without continuous refactoring and prudent design, every software system drifts toward maximum complexity. Seasoned architects often invoke the term software entropy to describe this inevitability. If you don’t actively fight disorder in a codebase, you’re essentially allowing entropy to win. The meme’s graph is a visual punchline to that effect: gravity (complexity) eventually drags the rocket of progress back down, and the developers’ spirits with it. In formal terms, the happiness decay is an emergent property of unmanaged complexity growth. This is why techniques like modular design, code reviews, and regular technical debt cleanup are treated as essential – they’re attempts to pump negative entropy into the system (i.e., inject order) to delay that unhappy intersection point. If you’ve ever heard a grizzled engineer half-joke that “The codebase is a living thing that gets more unruly each day”, they’re essentially referencing this phenomenon. Beneath the humor of the meme lies a near-universal law of programming projects: complexity, left unchecked, only moves in one direction – up – and eventually it overwhelms progress and morale.

Description

A graph on a black background plotting three curves over time: Progress (white), Complexity (orange/red), and Happiness (blue/purple). There is a dotted region labeled 'Vibe zone' where progress is high and complexity is still low - the sweet spot of vibe coding. As time progresses, the progress curve peaks and drops sharply while complexity skyrockets. Happiness stays high initially then plummets as complexity takes over. The 'Vibe zone' occupies only a brief early window, perfectly capturing how AI-assisted 'vibe coding' feels amazing at the start but rapidly collapses as the project grows beyond trivial complexity

Comments

16
Anonymous ★ Top Pick The vibe zone: that magical 48 hours where you mass-produce features at lightspeed, right before the complexity curve goes vertical and you realize the AI wrote 12 different state management patterns in the same file
  1. Anonymous ★ Top Pick

    The vibe zone: that magical 48 hours where you mass-produce features at lightspeed, right before the complexity curve goes vertical and you realize the AI wrote 12 different state management patterns in the same file

  2. Anonymous

    The 'Vibe Zone' is that brief, magical period where you think the initial architecture will scale, all the TODOs are minor details, and 'we'll refactor it later' sounds like a viable long-term strategy

  3. Anonymous

    You can pinpoint the exact spline where the architect declares, “We’ll just add one more layer of abstraction,” and the happiness graph starts paging out to disk

  4. Anonymous

    After 20 years in tech, I've learned the 'vibe zone' is just the brief moment between 'we've solved the problem' and 'wait, we've created seven new architectural concerns and now need a distributed consensus protocol for what used to be a simple boolean flag.'

  5. Anonymous

    The 'vibe zone' is that magical two-week window after the greenfield excitement wears off but before you realize the architecture decisions you made at 2 AM were actually terrible. It's when the codebase is complex enough to feel like real engineering, but not so complex that you need a PhD and three whiteboards to explain the deployment process. Enjoy it while it lasts - because once that complexity curve peaks and happiness flatlines, you'll be the one writing 'TODO: refactor this entire module' comments that will haunt the next team for years

  6. Anonymous

    That crossover where complexity beats progress is the exact moment sales closes an enterprise deal and your backlog turns into SSO, RBAC, audit logs, and a migration plan - your happiness becomes an exponential decay function

  7. Anonymous

    Projects obey the CAP theorem: pick any two from Progress, low Complexity, sustained Happiness

  8. Anonymous

    The dotted “Vibe zone” is that brief sprint between hello world and “please add SSO, GDPR, billing, retries, observability, and multi‑region,” where complexity compounds interest and converts developer happiness directly into tech debt

  9. @Algoinde 11mo

    My happiness is a sine with peaks coinciding with progress peaks following the complexity peaks, idk what this chart is about

  10. @Algoinde 11mo

    No tests = big happy

  11. @KratzKatz 11mo

    Progress should have an alternate path that goes below 0 if you start vibe debugging

    1. @Art3m_1502 11mo

      What is vibe debugging? The code is absolutely correct

      1. @KratzKatz 11mo

        Asking an LLM to help fix the code it generated

        1. dev_meme 11mo

          I just hope you do it with CLI tools and with llm having access to the rest of project and recent logs in terminal (and browser's console in case of fe)

          1. @KratzKatz 11mo

            This sounds like debugging with (potentially) broken support wheels. I prefer the gcc compiler screaming at me until i figure it out 🥰

          2. @qtsmolcat 11mo

            Which works great until Claude insists build completed successfully when it didn't, or it tries to fix a non-existent build error, or just gives up because it can't figure out the right gradle command

Use J and K for navigation