
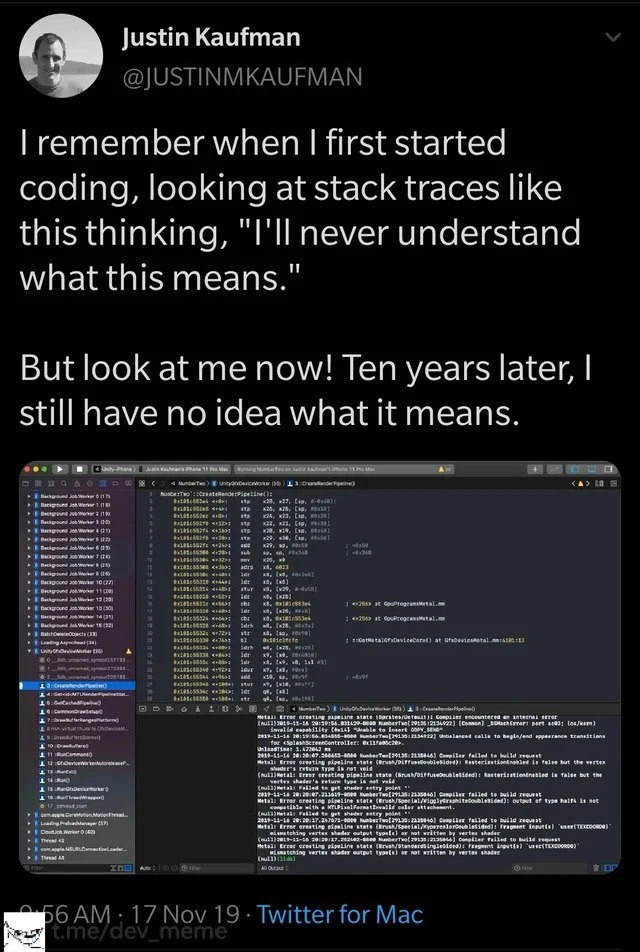
The Enduring Enigma of Low-Level Stack Traces
Description
This image is a screenshot of a tweet from user Justin Kaufman (@JUSTINMKAUFMAN). The tweet reads: 'I remember when I first started coding, looking at stack traces like this thinking, "I'll never understand what this means." But look at me now! Ten years later, I still have no idea what it means.' Below this text is a screenshot of a complex debugging environment, likely Xcode, in dark mode. The debugger shows multiple threads on the left, a central panel filled with dense, low-level assembly code from a graphics pipeline (UnityGfxDeviceWorker), and a console output at the bottom displaying a series of cryptic errors related to Apple's Metal graphics API, such as 'Metal: Error creating pipeline state'. The humor stems from the relatable experience of career progression not necessarily leading to omniscience. It highlights that even after a decade of experience, developers can still be completely mystified by bugs in highly specialized, low-level domains like graphics drivers or game engine internals, a humbling reality that feeds into persistent imposter syndrome


Comments
7Comment deleted
The main difference between a junior and a senior is that the senior has accepted that the abyss of the stack trace sometimes stares back
My senior-level crash triage: skim the ARM64 hieroglyphics, CMD-F for my namespace, don’t see it, file “Apple bug” and stroll back to the architecture review like a war hero
After ten years, I've mastered the art of scrolling past 47 layers of Spring's AbstractProxyFactoryBean to find the one line of my code that says 'user.getName()' - which, naturally, has nothing to do with the actual NullPointerException
After a decade in the industry, you realize that understanding stack traces isn't about comprehension - it's about pattern recognition and knowing which hexadecimal addresses to Google first. The real senior engineer move is confidently scrolling past 47 frames of framework internals to find that one line of your actual code, then pretending you knew exactly what you were looking for all along
Seniority is when LLDB drops you into ARM64, you type 'bt; image list -o -f', decide CI forgot the dSYMs again, and declare it a pipeline issue - both Metal and organizational
Stack traces: where the root cause hides deeper than your tech debt, under layers of framework voodoo you'll never rewrite
Experience didn’t make stack traces readable - it gave me heuristics: lots of libdispatch frames = race; top frame in our module = our bug; all hex addresses = we forgot dSYMs (again)