Skip to content
DevMeme
6152 of 7435
The Bell Curve of Statistical Model Complexity
DataScience Post #6747, on May 13, 2025 in TG

The Bell Curve of Statistical Model Complexity

Why is this DataScience meme funny?

Level 1: Don’t Overthink It

Imagine you spilled a cup of juice on the floor. One kid (who doesn’t know much about cleaning) simply grabs a paper towel and wipes it up – easy and done. Another kid, who just learned about all sorts of fancy cleaning gadgets, starts going overboard: he brings out a mop, then a vacuum, then a steam cleaner, and even a special stain remover spray – determined to use all the tools for this little spill. He’s running around trying every gadget, making a bigger mess and getting frustrated. Meanwhile, an older sibling walks in calmly, picks up a plain paper towel (just like the first kid did), and cleans the juice in a few quick wipes.

The point is: sometimes the simple solution works best. The kid with all the gadgets tried so hard to be clever that he just made things harder. The other two stuck to the basics – one by instinct, and one by experience – and the spill got cleaned up without fuss. It’s funny because we often see this in real life: someone learns a bunch of fancy tricks and wants to use them all, even when it’s not necessary. In the end, it’s a reminder: don’t overthink it. Often the easiest, most straightforward approach will do the job just fine. Even the wisest person in the room might choose that simple approach, while everyone else is busy complicating things.

Level 2: Bell Curve Basics

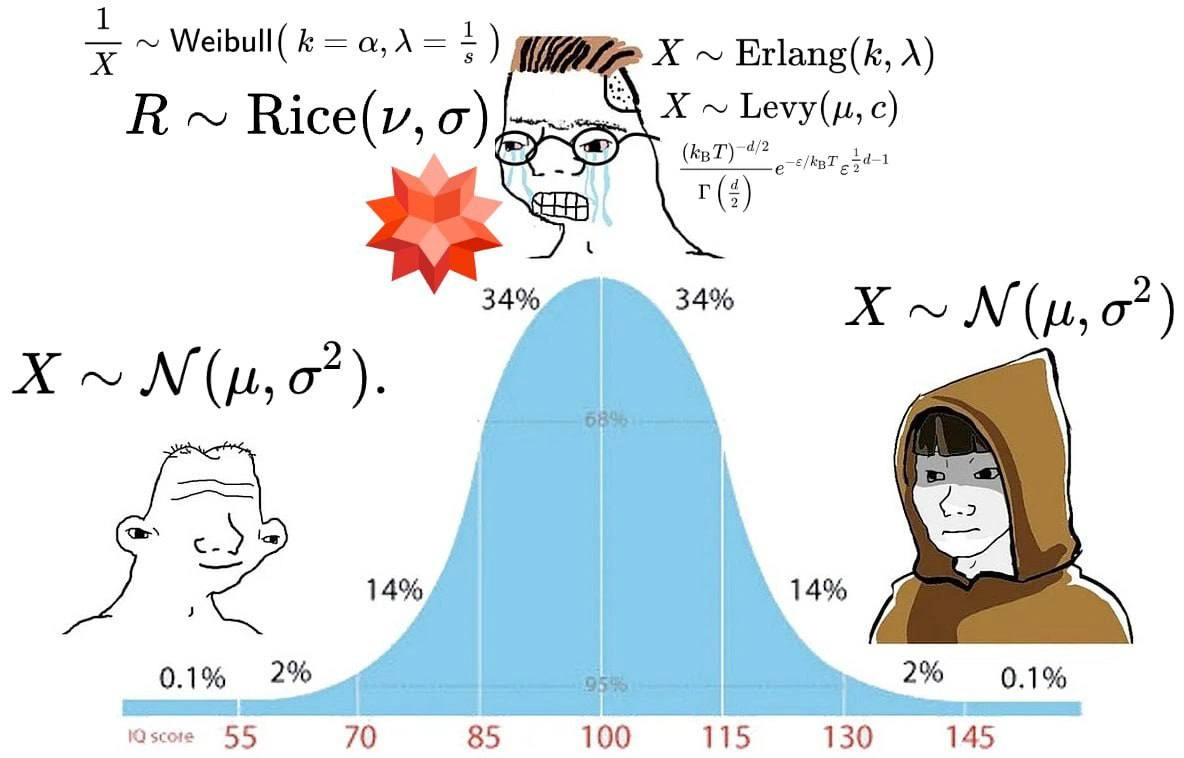
If you’ve taken an intro stats class or even just seen how IQ scores work, you know the bell curve – that smooth hump-shaped graph where most values cluster around the middle. That’s the normal distribution, also called a Gaussian distribution. It’s defined by two numbers: the mean (μ, the average value) and the variance (σ², which measures how spread out the values are – the square of the standard deviation σ). When we write “X ~ 𝒩(μ, σ²)”, we mean “the random variable X follows a normal distribution with mean μ and variance σ².” For example, IQ scores are often modeled as $𝒩(100,;15^2)$ – an average of 100 and a standard deviation of 15. On the bell curve image, you can see those numbers: 100 in the center, 115 one tick to the right (that’s 1σ above the mean), 130 (2σ above), etc., with percentages like 34% and 14% marking how much of the data falls in those ranges. (Fun fact: about 68% of a normal distribution is within one standard deviation of the mean – that’s why the sections between 85 and 115 on the IQ chart are each ~34%.) The normal distribution pops up everywhere because many natural things (heights, test scores, measurement errors) tend to form that pattern: most values are around average, and extremely high or low values are rare.

Now, the meme shows three cartoon figures (Wojaks) at different points on this IQ bell curve, each with a different mindset:

  • On the left end (low IQ side), the simple-looking guy is confidently saying “X ~ N(μ, σ²).” He’s basically saying “let’s just assume a normal distribution.” He likely does this because that’s the one model he’s familiar with – it’s straightforward and he doesn’t know any complicated alternatives. And honestly, assuming a bell curve is a pretty common, harmless starting point!
  • In the middle (average IQ), we have the “midwit” character (a Wojak with glasses, crying and surrounded by complex formulas). This represents someone who has learned a bunch of advanced statistics and is overthinking the problem. Instead of using the simple normal distribution, he’s throwing around a list of exotic probability distributions: Weibull, Rice, Erlang, Lévy, and even a fancy formula from physics (you can spot $k_B T$ and $\Gamma(d/2)$ in there). These are all real statistical distributions, but they’re more niche:
    • Weibull distribution: often used in engineering for things like how long products last before failing.
    • Erlang distribution: used for the total time until a certain number of events happen (for example, waiting time for 5 phone calls in a call center, if calls are random).
    • Rice distribution: used in communications/signal processing, for the strength of a signal that has a constant part plus random noise.
    • Lévy distribution: a distribution that allows very large values occasionally (a heavy-tailed distribution). It’s used in specialized cases like certain financial models or random walk processes where big jumps can happen.
    • The midwit even wrote down a formula that looks like something from thermodynamics (with Boltzmann’s constant $k_B$ and temperature $T$) – basically showing he’s pulling in extremely advanced math. In simpler terms, the midwit is using every advanced tool he can think of. He’s essentially saying “I don’t trust a plain bell curve; I have all these fancy models that might fit better,” and he’s going overboard trying them all. He’s got so much going on that he’s literally shown crying in the meme – analysis paralysis!
  • On the right end (high IQ side), the hooded “enlightened” character is also saying “X ~ N(μ, σ²).” It’s the same simple statement as the left side. The difference is this person is an expert who presumably knows about all those exotic distributions as well, but chooses the normal distribution on purpose because it’s practical. The expert isn’t bothered by the allure of complicated models – if the basic bell curve works, he’ll use it. The hooded figure looks calm and confident, in contrast to the frantic midwit.

The whole joke is about over-complicating vs. keeping it simple. The mid-level guy in the middle is over-engineering the solution – using way more complex math than necessary – while both the newbie and the veteran stick with the classic normal distribution. It’s like a student who just learned a bunch of new formulas and insists on using them for everything, versus a teacher who knows when the simple formula is enough.

In data science (and many other tech fields), a common piece of advice is to start simple. For instance, if you’re modeling some data, you often first assume it’s normally distributed, because that’s a reasonable default in many cases. Those other distributions the midwit is obsessed with are like specialized tools – they’re useful in specific situations, but if you try to use them all the time you’ll just confuse yourself and others. It’s similar to having a toolbox: just because you have a fancy set of wrenches and specialty tools doesn’t mean you need to use them for every job; sometimes a basic hammer does the trick.

The term “midwit” is internet slang for someone of moderate intelligence who complicates things to appear smart. This meme uses the midwit idea humorously: the average IQ character is doing a lot of extra work to model $X$ perfectly, but he’s missing the forest for the trees. The visual of him crying with the Wolfram Mathematica logo floating nearby suggests he might be using heavyweight math software to crank out all those models. Meanwhile, the low-IQ guy (maybe out of ignorance) and the high-IQ guy (out of wisdom) arrive at the same simple conclusion: just use the normal distribution.

So, the message is pretty clear: don’t overthink it. The normal distribution, that familiar bell curve, is often good enough for most purposes. The meme is funny because the person who “should” know better (the midwit who has learned all these advanced things) is making life harder than it needs to be. And the person who truly does know better (the expert) ends up agreeing with the simple approach of the beginner. It’s a lighthearted reminder in statistics and programming that adding complexity isn’t always the answer – sometimes the simple, tried-and-true solution (like modeling with $𝒩(μ, σ²)$) is the best approach.

Level 3: Mid-Curve Crisis

This meme lands squarely in DataScienceHumor, highlighting the classic clash between overengineering and pragmatism. The bell-curve graphic itself is an IQ distribution – a literal normal distribution – setting the stage for the “midwit” trope. On the left end (low IQ) we have a simpleton Wojak happily chirping “X ~ N(μ, σ²)” because that’s the one formula he knows. On the right end (high IQ) is the hooded enlightened Wojak echoing the exact same line: “X ~ N(μ, σ²)”, but out of quiet wisdom. The comedy stems from the middle character (around IQ 100, the peak of the bell curve) – the so-called midwit – who is in agony, surrounded by a blizzard of advanced formulas and Greek letters. He’s desperately trying to model $X$ with every fancy distribution under the sun (Weibull, Rice, Erlang, Lévy, you name it), likely to prove his sophistication. It’s a mid-curve crisis: the average-skilled data scientist is overthinking the problem to a hilarious degree.

Anyone who’s worked in AI/ML or analytics can recognize this dynamic:

  • The novice data analyst often assumes a bell curve (normal distribution) for everything by default – it’s what introductory courses and simple tools teach.
  • The intermediate analyst (the midwit) has learned about a cornucopia of exotic probability distributions and is excited to use them all. They’ll say, “Normal? Psh, real data is never perfectly normal!” and proceed to fit a dozen different models, tweak parameters, even transform the data (for example, taking $1/X$ to fit that Weibull) in an attempt to capture every nuance. They might fire up Wolfram Mathematica (hence the red star) or complex statistical libraries to do this, essentially overfitting to theoretical perfection.
  • The experienced senior data scientist, however, has been around the block. They’ve seen that in practice, assuming normality for, say, residuals or noise often works well enough. So the expert quietly models “X ~ N(μ, σ²)” as a sensible default unless there’s evidence to the contrary. No fanfare, no showing off – just a quick, robust solution.

To drive it home, here’s how each character approaches modeling $X$’s distribution:

Novice’s take (low IQ) Midwit’s take (mid IQ) Expert’s take (high IQ)
“I think it’s just a bell curve. Let’s say $X \sim N(\mu,\sigma^2)$.” “This doesn’t look normal... maybe we need a Weibull, or an Erlang! I’ll try every distribution I can find!” “It looks pretty normal to me. We’ll assume a Gaussian and keep it simple.”

The humor resonates because it’s too real in professional settings. We’ve all seen the enthusiastic mid-level colleague (or been them!) who complicates a straightforward analysis with esoteric statistical models – maybe fitting a Rician distribution to data that a simple Gaussian could handle, or obsessing over slight departures from normality that don’t actually matter for the conclusion. Sure, real-world data can deviate from the ideal bell curve (heavy tails, skewness, odd bumps – the midwit isn’t wrong to notice these). But the expert knows the cost-benefit trade-off: each exotic distribution added increases complexity, and you often need a lot more data to reliably fit those extra parameters. In a production environment, a simple Gaussian assumption is not only convenient but usually “good enough” to drive decisions or feed into models.

This meme is poking fun at statistical over-engineering. The midwit is basically overusing his new toolkit – bringing out graduate-level math for a job a basic model could do. Meanwhile, the truly wise solution is to stick with the basics. It’s the “I learned all these fancy models, so I’m gonna use them!” syndrome. By contrast, the wise engineer applies Occam’s razor: the simplest model (the normal distribution) often works best. The punchline is that the normal distribution – depicted at both ends of the IQ bell curve – is the unifying answer embraced by both the beginner and the master. The poor midwit in the middle ends up literally in tears, having made the task far more complicated than it needed to be.

In short, the meme uses the midwit IQ bell curve format to satirize a common scenario in tech and data science: intermediate folks over-complicate to show off or out of overzealous analysis, whereas true experts (and even total newbies) keep it straightforward. It’s a humorous reminder that sometimes, in data work and CS fundamentals, the simplest assumption – “X ~ N(μ, σ²) and carry on” – is the smartest move after all.

Level 4: All Roads Lead to Gauss

The meme’s deepest punchline hinges on fundamental probability theory. The central joke is that regardless of all the exotic distributional gymnastics the midwit attempts – sprinkling in a Weibull for $1/X$, a Rice distribution $R$ for some magnitude, Erlang and Lévy distributions for $X$ itself, and even a physics-style partition function – in the end, so many phenomena just end up approximating a Gaussian (a normal distribution). This is a nod to the Central Limit Theorem (CLT): as you combine enough independent random factors, their normalized sum tends to a normal distribution no matter the original distributions (provided they have finite variance). In other words, add up a ton of small effects, and you get that familiar bell curve.

The midwit’s math graffiti is essentially a tour of advanced distribution theory:

  • Weibull distribution (with shape $\alpha$ and scale $1/s$) often models lifetimes or failure times – here he’s even modeling the reciprocal $1/X$ with a Weibull, a rather convoluted transformation.
  • Rice (Rician) distribution ($R \sim \text{Rice}(\nu,\sigma)$) describes the magnitude of a vector with Gaussian noise and a constant offset (common in signal processing for random signal amplitude).
  • Erlang distribution ($X \sim \text{Erlang}(k, \lambda)$) is a special case of the Gamma distribution (sum of $k$ exponential events), used for waiting times in queues or network packet arrivals.
  • Lévy distribution ($X \sim \text{Lévy}(\mu,c)$) is a heavy-tailed distribution (actually a stable distribution with infinite variance) known from random walk theory and Lévy flights in chaotic processes (it makes extreme outliers more probable than a Gaussian would).
  • That daunting formula with $(k_B T)^{-d/2}/\Gamma(d/2)$ and an exponential $e^{-,\varepsilon/(k_B T)}$ is recognizable as the Maxwell–Boltzmann distribution of particle energies in $d$ dimensions (a form of the Gamma distribution from statistical physics). The midwit has literally summoned statistical mechanics into the mix!

Each of those distributions has its purpose: modeling specific skewed or heavy-tailed data, or specialized domains like reliability or radio signal strength. But the enlightened joke is that a huge range of real-world phenomena – especially those in Data Science and AI/ML – end up being modeled (or at least approximated) with a plain old normal distribution $X \sim \mathcal{N}(\mu,\sigma^2)$. Why? Because the normal is mathematically ubiquitous, thanks to CLT and also because of maximum entropy principles: given only a mean $\mu$ and variance $\sigma^2$, the distribution with the least assumptions (maximal entropy) is the Gaussian. It’s the “default” shape nature tends to produce when many independent factors are at play.

Irony: All that fancy math scribbled around the midwit might not yield a meaningfully better model if his data doesn’t strongly justify it. Normal distributions have a neat closed-form density,

$$f(x) = \frac{1}{\sqrt{2\pi,\sigma^2}} \exp!\Big(-\frac{(x-\mu)^2}{2\sigma^2}\Big),$$

and simple well-known properties (symmetry, the 68–95–99.7% rule, etc.). In contrast, those exotic distributions involve complicated special functions (like the $\Gamma(\cdot)$ gamma function) and often require heavy computation or specialized software (hello, Wolfram Mathematica – represented by that red spiky icon) to fit and analyze. The meme highlights a fundamental truth in modeling: unless you know your data-generating process truly demands a weird distribution (like genuinely heavy-tailed outcomes needing a Lévy, or life data with varying hazard rates suiting a Weibull), a Gaussian assumption is usually the pragmatic starting point.

In other words, the enlightened statistician (far right) and even the unschooled novice (far left) both stick with the Gaussian because, in the grand limit of things, everything kind of becomes normal. The midwit’s theoretical world tour of distributions is somewhat wasted effort – many complex models collapse to a bell curve when aggregated or viewed broadly. The cosmic joke: after all the integrals and Greek letters, you often come back to $\mathcal{N}(\mu,\sigma^2)$. All roads (in probability) lead to Gauss in the end.

Description

This meme uses the IQ Bell Curve (or 'Galaxy Brain') format to comment on statistical knowledge. It displays a blue normal distribution curve with an x-axis labeled 'IQ score'. At the low-IQ left tail (0.1%-2%), a simple Wojak character ('Brainlet') is shown next to the formula for a normal distribution, 'X ~ N(μ, σ²)'. At the high-IQ right tail (2%-0.1%), an enlightened, monk-like Wojak is shown next to the exact same formula. In the center, representing the majority with average intelligence (the 'midwit'), a crying, glasses-wearing Wojak is overwhelmed by a chaotic list of complex probability distributions and formulas, including 'Weibull', 'Rice', 'Erlang', 'Levy', and the Maxwell-Boltzmann distribution. The joke illustrates the Dunning-Kruger effect in a technical context: beginners and true experts appreciate the power and applicability of the fundamental normal distribution, while those with intermediate knowledge often get lost in esoteric, overly complex models, mistaking complexity for sophistication

Comments

17
Anonymous ★ Top Pick The junior data scientist uses a normal distribution. The mid-level one insists on a Bayesian hierarchical model with a custom prior they can't justify. The principal scientist uses a normal distribution, but after spending a week proving the Central Limit Theorem holds for their specific use case
  1. Anonymous ★ Top Pick

    The junior data scientist uses a normal distribution. The mid-level one insists on a Bayesian hierarchical model with a custom prior they can't justify. The principal scientist uses a normal distribution, but after spending a week proving the Central Limit Theorem holds for their specific use case

  2. Anonymous

    Senior data engineers know the real distribution in prod is ‘whatever passes the acceptance test’ - but a quick 𝒩(μ, σ²) gets them back to lunch before the midwit finishes typing Γ(d/2)

  3. Anonymous

    The true bell curve of software architecture: juniors and staff engineers both reach for simple solutions while the mid-levels are deriving the closed-form solution to the gamma function of their microservice mesh topology

  4. Anonymous

    The real senior architect move: spending three sprints researching exotic probability distributions for your load balancer, only to realize the default exponential backoff was fine all along. Sometimes the junior's 'just use normal distribution' isn't naivety - it's wisdom you'll rediscover after implementing Rice-Rician fading models for your HTTP retry logic

  5. Anonymous

    Career-level take: junior assumes Gaussian, midcurve fits Erlang/Weibull/Levy to everything, principal ships percentiles with bootstrapped CIs - because nothing in prod is normal even if the slide still says X ~ N(μ, σ²)

  6. Anonymous

    Rice for the RFP, Gaussian for prod SLOs - because stakeholders love bells, not tails

  7. Anonymous

    We swear service times are Erlang and outages are Levy, but the only distribution that survives OKRs, dashboards, and CFO reviews is N(μ, σ²)

  8. @SamsonovAnton 1y

    That IQ < 55 guy she tells you not to worry about...

    1. dev_meme 1y

      This should have been text under the image 🌚

  9. @anonusernametg 1y

    On a side note, I really need to refresh my memory on math... Any good sources for a dev that has distanced himself from math for a few years?

    1. @pooyabehravesh 1y

      Mathematics and Calculus, George B. Thomas

      1. @anonusernametg 1y

        1000+ pages 😬 thanks though I guess I'll just read some pages at a time

        1. @dsmagikswsa 1y

          introduction book in a nutshell 😂 1000 page+

    2. @Johnny_bit 1y

      Coupla years ago there was app called "brilliant" that let one learn a lot of stuff in practical way, but dunno how advanced it got vs how advanced you want

      1. @anonusernametg 1y

        The YouTube sponsor thingy? I specifically avoid anything that does sponsorships on YouTube. It hasn't failed me. Thanks for the suggestion though

      2. @colllapse 1y

        you mean app for site brilliant dot org?

    3. @kddpq 1y

      Introductory Real Analysis by Kolmogorov

Use J and K for navigation