Prometheus vs. The Printer: A Port 9100 Horror Story
Why is this Observability Monitoring meme funny?
Level 1: Wrong Number, Right Print
Imagine you want to check on your friend every day, so you decide to call them and ask “How are you?” But you accidentally wrote down the wrong phone number. Instead of calling your friend, you end up calling a printer in an office. You don’t know you got the number wrong – you just dial the number and politely ask, “Hey, how are you? What’s going on today?” Of course, a printer can’t talk, but it can print. So every time you call and speak, the printer listens to your voice as noise and prints out whatever it hears as text on paper. You intended to get an answer from your friend, but instead you get a sheet of paper that literally shows what you said. You keep doing this every day, wondering why your friend never responds – and the printer keeps printing your question over and over! It’s a silly mix-up: the wrong address (or number) means your message goes to a completely unintended place. The funny part is how literal the outcome is – the poor printer is just doing its job, printing everything it receives, even though your question was meant for someone else. In the computer world, that’s what happened: a monitoring program was “asking” a server for data, but it had the wrong address and was actually talking to a printer. The printer “answered” by printing the question on paper. It’s like sending a letter to the wrong house and the house’s resident keeps mailing you back a copy of your own letter! We laugh because it’s an innocent mistake with a comedic result – nobody expects a printer to get love notes from a computer every few seconds.
Level 2: The Port 9100 Mix-Up
For a more junior developer or someone new to these tools, let’s break down why it’s funny (and instructive). Prometheus is a popular open-source monitoring system. Instead of waiting for servers to send it data, Prometheus goes out periodically to scrape (fetch) metrics from its targets. Targets are usually specified as <IP>:<port> where an agent (like node_exporter) serves metrics over HTTP. By default, node_exporter — which collects system stats (CPU, memory, etc.) — listens on port 9100. Now, coincidentally, many office/network printers also use port 9100 for a different purpose: accepting print jobs. In fact, in HP printers this is often called HP JetDirect or the "raw printing port". It means you can send a stream of text or printer-formatted data (PCL, PostScript, etc.) directly to port 9100 on the printer, and it will print it. There’s no high-level protocol like HTTP in that case — the printer just expects print data.
Now imagine you’re configuring Prometheus and you have to list a bunch of server IPs that have the node_exporter running. Maybe you have a file of IP addresses or you copy-paste them. It’s easy to accidentally type one number wrong (this is colloquially called a fat-finger error – like hitting the wrong key). Suppose the server was meant to be at 10.0.0.32:9100 but you accidentally wrote 10.0.0.23:9100. And let’s say 10.0.0.23 is actually your office printer. Prometheus doesn’t know that; it just sees another target to query. So every 15 seconds (a typical Prometheus interval), it sends an HTTP request like:
GET /metrics HTTP/1.1
Host: 10.0.0.23:9100
User-Agent: Prometheus/2.25.2
Accept: application/openmetrics-text, ...
Prometheus is asking for /metrics on that host, expecting the node_exporter’s metrics output (just a bunch of text with numbers). But what happens on the other side? The printer receives a connection on its port 9100. Printers don’t speak HTTP – they’re essentially just waiting for print commands or data. However, the data in this case is printable text (it’s not what the printer expects as a proper formatted print job, but it’s still text). Many printers in raw mode will go ahead and print any text they receive. So the printer prints out literally the HTTP request lines (GET /metrics HTTP/1.1, and so on). Every 15 seconds, another page (or another line) comes out with the same content, because Prometheus keeps trying to get a response.
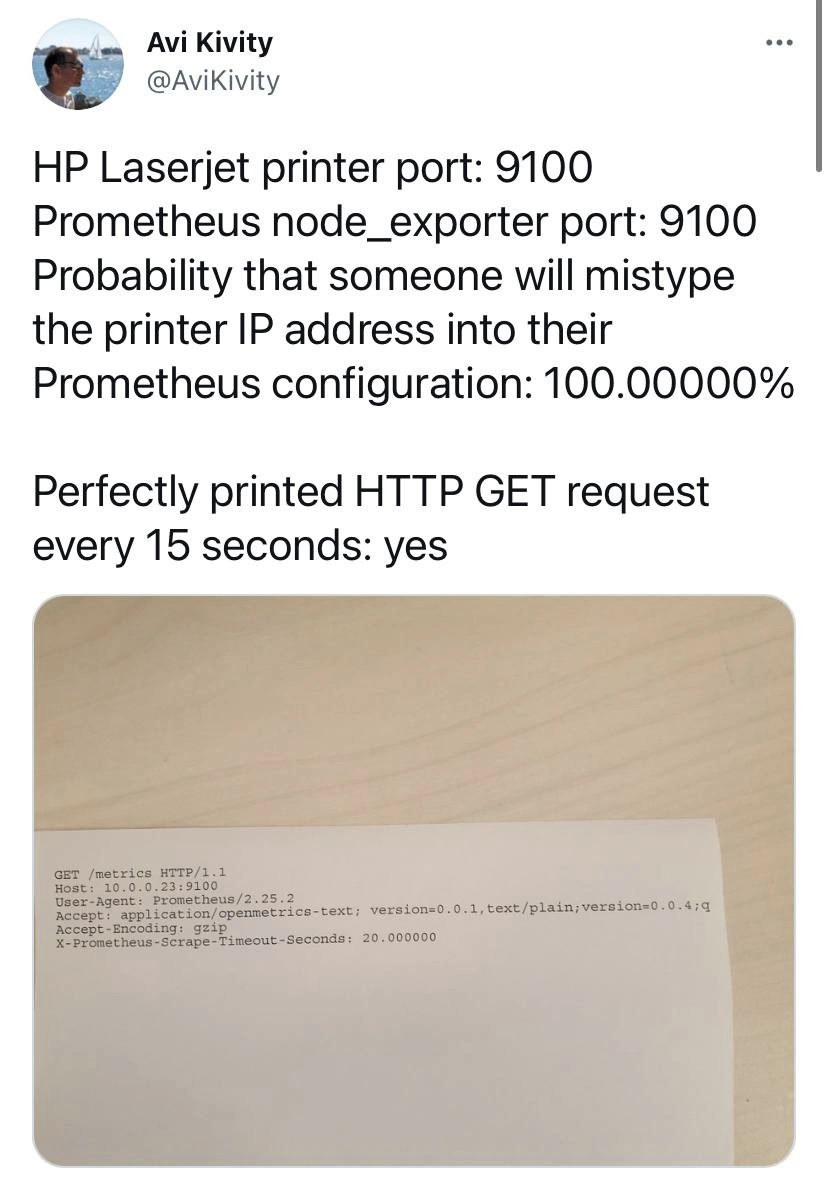
The tweet by Avi Kivity highlights this with humor: the matching port numbers (9100) create a perfect trap for mistakes. The “probability… 100.000000%” is obviously exaggerated, but it feels inevitable if you manage enough servers and also have networked printers. At some point, someone’s going to mix up an IP or reuse a config accidentally. It’s a sysadmin/DevOps inside joke that configurations can and will go wrong in the weirdest ways. Instead of getting monitoring metrics, you end up with the printer spewing out what is effectively a log of Prometheus’s requests. This is amusing because it’s a harmless screw-up: nobody’s hacked anything, nothing’s broken in a dangerous way – but you’ve created a little printing ghost that outputs techie gibberish every few minutes. It illustrates the importance of careful configuration: one wrong number in an IP address can lead to very puzzling behavior. If you saw a stack of papers with HTTP requests on the printer tray, you’d scratch your head – until you realize, “Oh no, Prometheus is hitting the wrong target!” For a newcomer, the takeaway is understanding what Prometheus and node_exporter do (monitoring via pulling metrics) and how a simple mix-up in ports/IPs can cause a funny bug. It’s a combination of Monitoring tools, network ports, and plain old human error. And yes – the observability tool meant to help you keep an eye on systems can accidentally keep an eye on (or rather, output from) a printer if you’re not careful! This kind of bug falls under misconfiguration errors – not a code bug in Prometheus itself, but a user configuration mistake that leads to unintended interactions between systems.
Level 3: Observability Paper Trail
At the highest technical level, this meme highlights a Prometheus monitoring setup colliding with an HP LaserJet printer thanks to an unfortunate port overlap. In the world of Observability and DevOps tooling, Prometheus uses a pull model: it periodically sends HTTP GET requests to scrape metrics from endpoints (like the node_exporter agent on servers). By convention (and a pinch of irony), Prometheus’ node_exporter listens on port 9100 by default. Meanwhile, many networked printers (especially older HP LaserJets with JetDirect cards) listen on port 9100/tcp for print jobs. This port is commonly known as “raw” printing mode – whatever data you send to a printer’s port 9100, it assumes is printable content. Now imagine an SRE or developer configuring Prometheus targets and mistyping an IP address: instead of the metrics endpoint, they accidentally point to the printer’s IP. Prometheus dutifully starts sending GET /metrics HTTP requests to the printer at 15-second intervals (a typical scrape interval). The printer, equally dutiful in its simple role, treats each HTTP request as a print job. The result? A literal paper log of Prometheus’ queries. The tweet in the meme wryly notes the “Probability that someone will mistype the printer IP into their Prometheus configuration: 100.000000%” – a tongue-in-cheek way of saying “if a mistake can happen, it absolutely will.” Seasoned ops folks have learned that given enough servers (and enough sleep-deprived nights), someone eventually fat-fingers an IP or port. Here’s how such a misconfiguration might sneak in: one server’s IP ends in .32 but the printer is .23, a one-digit slip in a config file and boom – your monitoring system is unknowingly adopting the office printer as a metrics source. Consider a Prometheus config snippet for scraping node exporters:
# Prometheus configuration (fragment)
scrape_configs:
- job_name: 'node_exporters'
static_configs:
- targets:
- '10.0.0.32:9100' # Correct: server's node_exporter
- '10.0.0.23:9100' # Oops: the printer's IP by mistake
In this scenario, Prometheus will try to scrape 10.0.0.23:9100/metrics repeatedly. The poor printer at 10.0.0.23 doesn’t know about /metrics or HTTP headers; it just prints whatever data arrives. The meme shows a photo of a page printed with raw HTTP request text: the top lines show GET /metrics HTTP/1.1 and Host: 10.0.0.23:9100, followed by User-Agent: Prometheus/2.25.2 and other headers like content types and an X-Prometheus-Scrape-Timeout-Seconds. From a senior DevOps perspective, the humor cuts deep: this is classic monitoring misconfiguration meets real-world hardware. It’s a collision of contexts – software expecting JSON or text metrics, hardware interpreting it as a command to mark ink on paper. The DevOps/SRE crowd has a term for such goofs: “configuration issue” (or a less polite variant during 3 AM incidents). It’s funny because it’s true – anyone who’s maintained large config files or managed networks has a war story of a one-character mistake causing absurd consequences. Here, the absurdity is harmless and hilarious: every 15 seconds, instead of time-series data, the observability system produces a hardcopy of an HTTP request. It’s as if the monitoring tool is logging to the printer – the ultimate paper trail! Beyond the joke, it subtly underlines best practices: know your default ports, implement validation (could Prometheus detect it’s talking to a printer? probably not easily, it just sees no metrics), and double-check target IPs, especially when different device types lurk on the network. In short, the meme lands with senior engineers because it perfectly captures the intersection of a small configuration bug and real-world system behavior: the frustration of a monitoring query hitting the wrong target, mixed with the comedic relief that at least this bug logs itself… albeit one page at a time. It’s DevOps karma: what you intended as digital data got manifested in analog form, all because of a stray character in a config file.
Description
This image is a screenshot of a tweet by Avi Kivity (@AviKivity). The text describes a scenario where an HP Laserjet printer and the Prometheus node_exporter both use the same default port: 9100. The tweet humorously states there's a 100% probability someone will mistype the printer's IP address into their Prometheus configuration, leading to 'Perfectly printed HTTP GET request every 15 seconds: yes'. Below the text is a photo of a piece of paper that has been printed from a printer. The printed text is a raw HTTP GET request, including headers like 'GET /metrics HTTP/1.1', 'Host: 10.0.0.23:9100', 'User-Agent: Prometheus/2.25.2', and 'X-Prometheus-Scrape-Timeout-Seconds: 20.000000'. The joke is a classic example of a 'fat-finger' configuration error. An engineer, intending to scrape metrics from a server, has accidentally pointed their monitoring tool (Prometheus) at a network printer. The printer's JetDirect protocol on port 9100 simply interprets the incoming data stream - the HTTP request from Prometheus - as raw text to be printed, resulting in a continuous waste of paper and a monitoring alert that never fires

Comments
13Comment deleted
Finally, a monitoring system with a hard-copy audit trail. Now let's see if the ink costs more than the AWS bill
Mistyped the node_exporter IP, so the LaserJet now prints GET /metrics every 15 s - finally achieved immutable paper logs with infinite write-ahead buffering and a retention policy that depends solely on who takes out the recycling
Finally found a monitoring solution with a paper trail that auditors will actually believe exists
When your observability stack becomes a little too observable - nothing says 'production incident' quite like your printer generating a paper trail of Prometheus scrape requests. At least you'll have physical evidence for the postmortem: 'Root cause: someone fat-fingered an IP in the scrape config, turning our HP into the world's most expensive metrics exporter with a 15-second SLA on toner depletion.'
When service discovery is a spreadsheet and everything listens on 9100, Prometheus implements dead-tree logging with a janitor-based retention policy
Prometheus scrape configs: where one extra zero turns observability into a bottomless print queue
Accidentally added the LaserJet’s IP to Prometheus (9100); now our observability has a literal paper trail - GET /metrics every 15s, retention policy: until the tray runs dry
What Comment deleted
9100/TCP port is used for PDL (Page Description Language) datastream which by default treats everything as a text and starts the actual print when a connection is closed. Comment deleted
TIL ty for the info Comment deleted
Lol what I thought printers had an inability to process data unless you're using the right driver Comment deleted
Driver acts as a bridge bw the system and printer. Comment deleted
how to print out requests LOL Comment deleted