The Official Machine Learning Debugging Protocol
Why is this AI ML meme funny?
Level 1: Yelling at a Car
Imagine you’re trying to get your car to run, but it just won’t start. A sensible approach would be to check the basics: Do you have gas in the tank? Is the battery connected? Maybe open the hood and see if anything looks weird. But instead, you just sit in the driver’s seat, stare at the dashboard, and start yelling at the car manufacturer for making a bad car. 😠🚗 Of course, the car isn’t going to fix itself just because you’re shouting at it. In this meme’s story, the programmer is doing the same thing with his code – not really checking anything step-by-step, just glaring at the code and blaming TensorFlow (a tool he used to build his model) for all the trouble. It’s funny because we can all picture that frustrated person, hoping that if they get angry enough, the problem will magically reveal itself. It’s a bit like having a tough puzzle and, instead of trying different puzzle pieces, you just keep staring and scolding the puzzle for being tricky. That usually doesn’t solve anything, but in the moment it sure feels like all you can do!
Level 2: No Tools, No Clue
Let’s break down what’s happening in this tweet in simpler terms. Chip Huyen is describing a person trying to debug (find and fix errors in) a machine learning model, but they’re not using any of the usual tools or techniques – just staring at the code and getting mad. The humor comes from listing all the things he didn’t do, which are basically the standard things you should do when debugging. Here’s what those items mean:
ipdb: This stands for Interactive Python Debugger. It’s like a magnifying glass for your Python code. With
ipdb, you can pause the program at any line and poke around: check variable values, step through each line of code, and see what’s happening under the hood. Not using ipdb means our friend isn’t actually stepping through the code interactively at all. It’s akin to flying blind – he’s not setting any breakpoints to halt execution and inspect things. Many developers useipdb(or the built-inpdb) to efficiently find where things go wrong. Skipping this tool suggests either he’s not comfortable with it or just so frustrated he forgot it exists.Unit tests: These are like little check-ups for your code. A unit test is a small piece of code that automatically verifies that one part of your program works as expected. For example, if you wrote a function to normalize data, a unit test would feed it some sample input and check that the output meets certain criteria. In machine learning, writing unit tests can catch bugs in data preprocessing or in custom math functions you implement. The tweet implies he wrote no tests at all. That’s unfortunately common in one-off research code – people run the whole training and just see if the final result is good, rather than testing each part on the way. No unit tests means if a part of the code is doing something weird, there’s no quick way to know; you only find out when the whole model’s results are bad (and by then it’s hard to tell which part caused it).
Visualization: In debugging ML models, visualization usually means plotting or using tools to literally see what the model is doing. For instance, you might plot the training loss curve over time to see if it’s going down or spiking, or you might visualize the model’s predictions versus true values. A popular tool for this is TensorBoard, which comes with TensorFlow – it lets you see graphs, histograms of weights, etc. Not using any visualization means he’s not checking any graphs or charts that could provide clues. It’s like trying to fix a car engine without opening the hood – you’re not looking at important indicators (like loss going to NaN or accuracy stagnating) that could tell you what’s wrong. A simple plot might have shown, say, the model isn’t learning at all after a certain point, hinting at a vanishing gradient or learning rate issue. But he didn’t look at any, apparently.
Disabling regularization: Regularization refers to techniques used in training to prevent overfitting – basically, to stop the model from just memorizing the training data. Common regularization methods are dropout (where some neurons are randomly turned off during training) or weight decay (which discourages overly large weights). These techniques generally make the model a bit weaker or more constrained so that it hopefully generalizes better. When debugging, a trick is to turn off these regularizers temporarily. Why? Because if you remove those constraints, the model should be able to fit the training data much more easily (even if it overfits). If you disable regularization and the model still can’t fit the training data well, then something is fundamentally wrong with your setup (maybe a bug in the data input, or the model architecture isn’t suitable). So, toggling regularization off is like taking the training wheels off to see if the bike can at least go (perhaps wobble, but go). The tweet says he didn't even try that. It suggests either he didn’t think of it or was avoiding touching the hyperparameters at all. Not experimenting with this means he might be missing a quick way to diagnose if the issue is with his model’s capacity or something else.
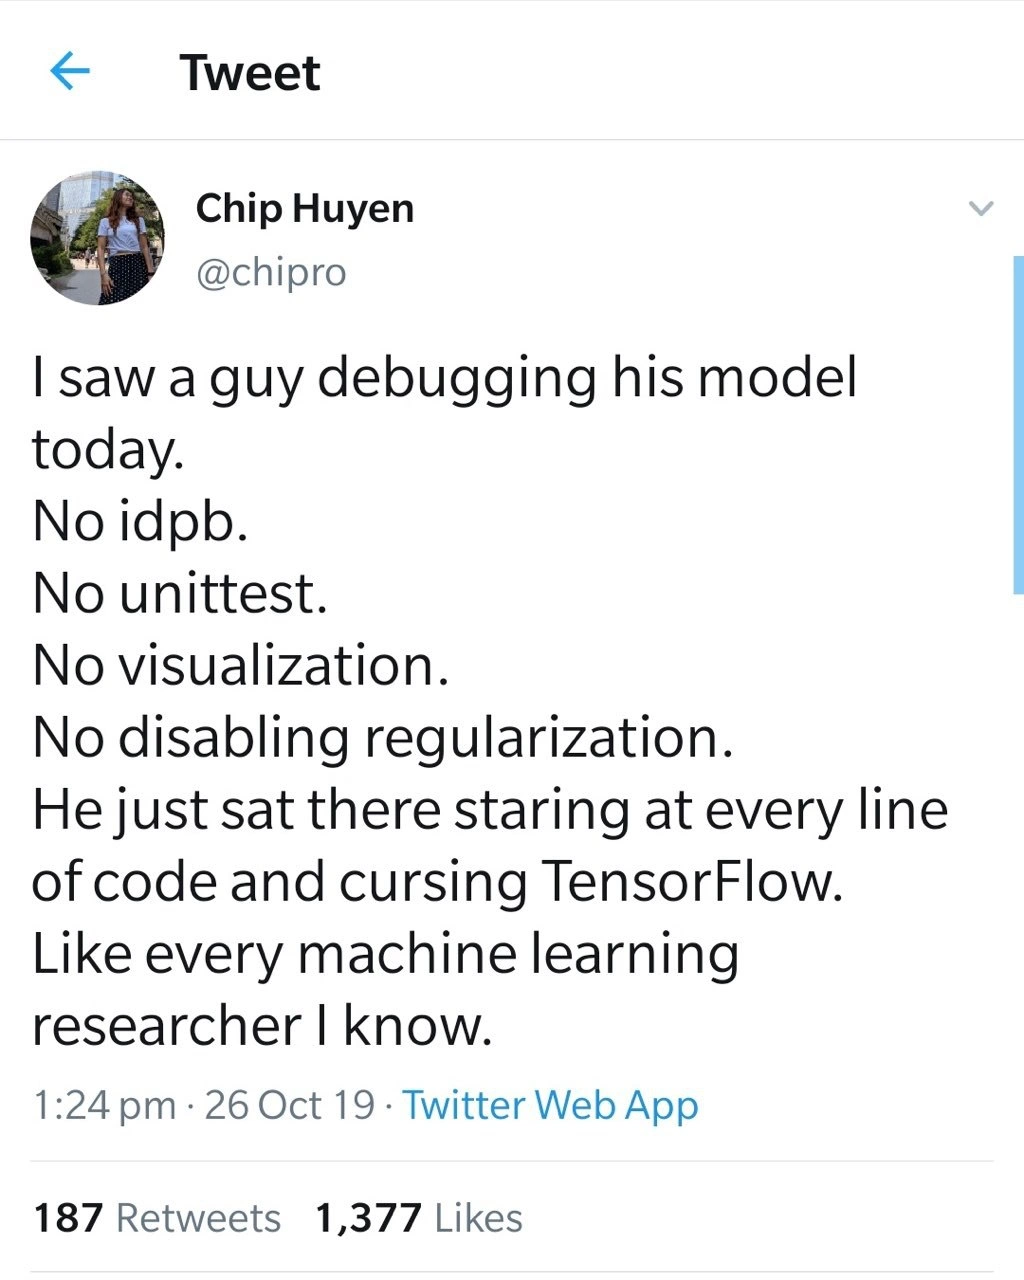
After listing all these things he didn’t do, Chip describes what he actually did: "He just sat there staring at every line of code and cursing TensorFlow." In plainer language, this guy was likely so stumped that he resorted to scrolling through his Python script from top to bottom repeatedly, hoping to spot a mistake just by reading it. And while doing so, he was cursing (yelling at or blaming) TensorFlow, the library he’s using, as if the library were a person who could hear his frustration. TensorFlow is just the tool – it doesn’t actually get upset or change because you yell at it, of course. But we’ve all been angry at our tools before. It’s an emotional outlet when you’re really stuck. Finally, Chip adds, "Like every machine learning researcher I know." That line basically means: this is such a common scene in the ML world! She’s poking fun at the fact that many ML researchers end up debugging in this unsystematic way, even though they are very smart people. It’s a tongue-in-cheek way to say “yep, this is our life sometimes.”
So, the whole tweet is highlighting a gap between the proper way to troubleshoot and what people often actually do under pressure. Instead of methodically using a debugger, writing tests, visualizing results, or adjusting regularization to gather clues, many just end up doing a frustrated code stare-down. It’s both funny and a bit cringey because it’s true – skipping all the helpful tools makes debugging way harder, and yet in the wild world of machine learning research, it happens a lot.
And let’s be honest: cursing TensorFlow might make you feel a teeny bit better in the moment, but it’s not going to magically resolve the bug. Sometimes, though, after exhausting all ideas, you do end up just fuming at the screen. This tweet turns that common experience into a relatable joke for developers.
Level 3: Method vs Madness
This meme lands close to home for a lot of developers and researchers in Machine Learning. It highlights the chasm between textbook debugging practices and what often happens in reality when tuning a tricky model. The tweet lists all the sensible debugging steps our troubled ML researcher did NOT do – no interactive debugger (ipdb), no unit tests, no visualization tools, no tweaking of regularization settings. Instead, he's doing the time-honored staring_at_code ritual, punctuated by creatively cursing at the TensorFlow library. It's funny because it's true: many of us have been that person, eyes glazed over at 3 AM, combing through hundreds of lines of model.fit() logic and suspicious layer definitions, muttering "it should work... why on earth is this not working?".
Why is this scenario so familiar? In an ideal world, you'd methodically debug a machine learning pipeline like any other software project: use a debugger to step through data preprocessing, write unit tests to verify each piece (e.g., does the data augmenter output what we expect? Is the layer computing the right shape?), plot out the model’s performance after each epoch to catch divergence, and toggle regularization or other hyperparameters to isolate the issue. These are the best practices. But in the grim reality of crunch-time research, people often skip straight to desperation mode. Machine learning projects (especially in research) are notorious for lacking tests and rigorous debugging. Part of it is cultural – many ML researchers come from academic backgrounds where code is a means to an end (the experiment results), not a polished product. Writing extensive unit tests for an experimental model isn’t common; by the time you’d finish, the research question might have changed! There’s even a running joke in the community about ml_unit_test_neglect: if the model trains and gives decent accuracy on a known dataset, that's the only "test" that mattered. Until it doesn’t work, of course.
Another reason for this gaze-upon-code approach is that model_debugging_methodology isn’t straightforward. Often the “bug” in machine learning isn’t a crashing error but a conceptually wrong behavior: lousy accuracy or a loss that won’t go down. There’s no obvious exception or stack trace for “my validation metric is 20% lower than expected.” So what do people do? They resort to a combination of intuition, superstition, and hope. The tweet humorously captures that: the guy is essentially doing a print_statement_debugging_ml session in his head – painstakingly reviewing every line to see if he can spot a flaw, and likely inserting print() statements in a few places (or at least considering it). It’s the ML equivalent of checking if you left the oven on, except the oven is millions of matrix multiplications deep inside a neural network.
And oh, the cursing TensorFlow part – that’s the cherry on top. Anyone who has wrestled with TensorFlow (especially older TF1.x versions) can attest that it could be a love-hate relationship. TensorFlow is powerful, but when something goes wrong, the error messages or the silent failures (like getting NaN for your loss out of nowhere) can drive you insane. It’s both cathartic and comically pointless to shout at the framework: "Why won’t you just TRAIN, you piece of junk?". Blaming the tool is a natural emotional response when you're out of ideas. Seasoned devs chuckle at this because we’ve all externalized our frustration like that, even though we know the bug is probably our own fault. The tweet’s punchline "Like every machine learning researcher I know." drives home that this ad hoc approach is practically a stereotype in the AI/ML world. It’s a gentle roast of the research community: brilliant PhDs coding cutting-edge DeepLearning algorithms, yet debugging them with the finesse of a developer from the 1970s (when print debugging was king).
The humor works on multiple levels. For those in AI/ML, it’s a nod to the shared struggle – the DebuggingFrustration that unites us when a model just won't behave. For seasoned software engineers, it’s a facepalm moment: "No tests? No debugger? No logs? Of course he’s stuck!" It highlights an ongoing gap: machine learning systems are complicated, and the tooling and practices around them (especially back in 2019) often lagged behind traditional software. We had amazing algorithms to let neural nets learn, but our day-to-day Debugging_Troubleshooting tactics for those algorithms were sometimes pretty primitive. It’s a case of model_debugging_methodology in practice being far messier than what any tutorial or professor would recommend. And that contrast – between what we should do and what we actually do under pressure – is both funny and a little painful. After all, nothing screams “I’m desperate” louder than a developer just staring_at_code hoping the bug will reveal itself by sheer willpower. Been there, done that, got the t-shirt (with coffee and tears stains all over it).
Level 4: Gradient Descent into Madness
Deep learning models are essentially giant math machines: they turn data into predictions by adjusting millions of numbers (weights) through gradient descent. Debugging them can feel like debugging math itself. In a framework like TensorFlow (especially circa 2019 with static computation graphs), your Python code doesn't execute line-by-line in the usual way – it builds a computational graph of operations first, then runs that graph efficiently in C++/GPU. This means traditional step-by-step debugging (like setting breakpoints with ipdb) often can't peer inside the graph execution. It's as if the code is doing its work in a hidden world. If something goes wrong, you might not get a simple error at the faulty line. Instead, you get mysterious misbehavior: the model fails to learn or outputs nonsense, with no obvious stack trace to follow.
Under the hood, autodiff (automatic differentiation) is computing gradients through many layers. A tiny mistake, say summing when you meant averaging, won't throw an exception – it will just subtly alter the training dynamics. The result? A model that stubbornly won't converge, and you scratching your head. There’s deep theory here: neural network training is a high-dimensional, non-convex optimisation problem. No neat theorem guarantees a fix for "why won’t my accuracy improve?" It's a bit like the halting problem of machine learning – no algorithm can definitively tell you why your model isn't learning. So ML researchers rely on heuristic debugging: check if the data pipeline is correct, see if the loss goes down on a small subset of data, or disable regularization (like dropout and weight decay) to let the model overfit deliberately. Turning off regularization is a classic sanity check: if even with no regularizing forces the model can't fit the training data, there's likely a fundamental bug (like mislabeled data or a broken layer connection).
So why is our hapless researcher just eyeballing code? Because when facing a complex training script, sometimes print statements and staring at tensor shapes in the graph is all you can do to trace the flow. The usual arsenal of debuggers and unit tests feels almost powerless against a misbehaving neural net that technically runs without errors. This is the deep learning debugging dilemma: the code is correct enough to execute, but the model results are wrong. And without good tools to inspect large tensor values or gradient flows, one ends up performing a kind of debugging seance – poring over every line of code, trying to psychically divine where the logic went astray, occasionally uttering incantations (or curses) at TensorFlow in hopes of appeasing whatever gradient gods might be listening. In short, the sheer complexity and opaque internals of training algorithms can push even experienced practitioners into a ritual of frustration, battling theoretical demons that don’t show up in error logs.
Description
A screenshot of a tweet from user Chip Huyen (@chipro), posted on October 26, 2019. The tweet reads: 'I saw a guy debugging his model today. No idpb. No unittest. No visualization. No disabling regularization. He just sat there staring at every line of code and cursing TensorFlow. Like every machine learning researcher I know.' The image captures the text of the tweet, the author's name and handle, the timestamp, and the engagement metrics of 187 Retweets and 1,377 Likes. This meme resonates deeply with machine learning practitioners by highlighting a common, albeit inefficient, debugging method. It contrasts the structured, tool-assisted debugging processes of traditional software engineering (using debuggers like 'ipdb', unit tests, and visualization) with the brute-force, intuition-driven, and often frustrating reality of troubleshooting complex ML models. Cursing TensorFlow, a powerful but notoriously complex framework, is a relatable rite of passage, making the tweet a humorous commentary on the state of ML development and the gap between theory and practice

Comments
7Comment deleted
Traditional debugging is a science; you form a hypothesis and test it. ML debugging is an exorcism; you sprinkle print statements and pray the demon tells you its name
If “stare-and-swear” were an officially supported TensorFlow debugger, half our research backlog would suddenly count as observability work
The most sophisticated neural network in that room was the one between his ears, desperately trying to backpropagate through TensorFlow's error messages without gradients, checkpoints, or hope - essentially implementing biological gradient descent with a learning rate approaching zero and frustration approaching infinity
Ah yes, the classic ML researcher debugging methodology: disable your IDE's debugger, skip the unit tests, ignore TensorBoard, and just *will* the gradients into convergence through sheer force of staring and profanity. It's like trying to fix a distributed system by reading the source code of TCP/IP - technically possible, but you're going to have a bad time. At least when your loss explodes to NaN, you'll know exactly which line of code to curse at
The gradient of blame is always pointing at TensorFlow when you skip seeds, TensorBoard, and unit tests - zero regularization, maximum swearing
TensorFlow's real black box: no stack traces, just gradients gaslighting you into questioning your PhD
Senior ML debugging playbook: seed everything, disable dropout/L2, assert feature invariants - when loss still explodes, rebrand the stare-and-swear session as an unsupervised ablation study