Skip to content
DevMeme
3611 of 7435
K8s Services and Cluster Resources: A Love Story Monitored by Prometheus
Observability Monitoring Post #3948, on Nov 20, 2021 in TG

K8s Services and Cluster Resources: A Love Story Monitored by Prometheus

Why is this Observability Monitoring meme funny?

Level 1: The Ignored Friend

Imagine a big playground where there’s a pile of snacks that all the kids are supposed to share. One very energetic kid (the microservice) runs over and grabs almost all the snacks (the cluster’s resources like cookies representing CPU and memory). This kid is so busy munching away happily with the snacks held tight, almost like a big hug, that they don’t notice their friend. Now, there’s another kid who was supposed to count the snacks and let a teacher know if supplies were low – that’s like Prometheus, the monitoring friend. But this friend ends up sitting off to the side, with an empty stomach, watching sadly because there are no snacks left for them to even stay active. The greedy kid and the snacks are like the apps using up all the computer power, and the left-out friend is like the monitoring system that gets ignored. It’s funny in a silly way: the very friend who could tell everyone “hey, we’re running out of snacks!” wasn’t given any snacks and is ignored. So nobody realizes trouble is coming until all the snacks are gone and kids start crying – because the friend who would have warned them was left out the whole time. In simple terms, the meme is joking that if you let something use all the resources without sharing, the helper who watches over things can’t do their job.

Level 2: Monitoring Left Out

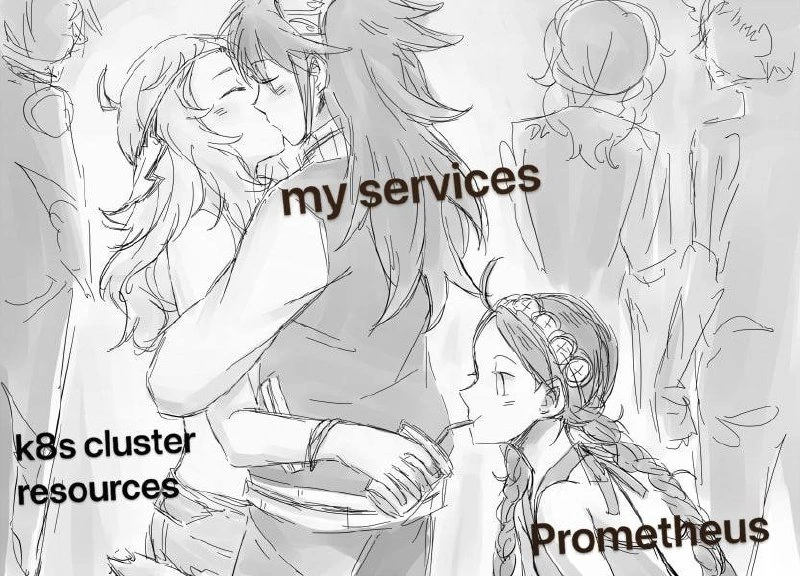
To understand this meme, let’s break down the roles of each character label. “My services” refers to a developer’s microservices – these are the many little applications running in containers on a cluster. They provide features to users and typically scale out for performance. “k8s cluster resources” means the combined computing power of the Kubernetes cluster: all the CPU cores and memory across the nodes. In a perfect world, Kubernetes (often abbreviated “k8s”) shares these resources among all running containers according to their needs and limits. But here, my services are shown grabbing all those resources (hugging them tightly) – implying the services are using too much CPU and RAM. And who’s that on the side? Prometheus – a popular open-source monitoring tool (part of the observability stack) used to gather metrics (like CPU usage, memory usage, request rates) from your services. Prometheus usually runs in the same cluster to watch everything and alert the team when something’s wrong.

The joke is that the microservices are consuming so many resources that little Prometheus can’t get any for itself. In Kubernetes, you’re supposed to set resource requests and limits for each service. A resource request reserves some CPU/Mem for a container, and a limit caps how much it can use. If teams configure these poorly – for example, if every microservice is allowed to just take as much as it wants – then those apps will fill the machine’s CPU and memory (the cluster resources) completely. Prometheus, which also needs CPU to scrape metrics and memory to store time-series data, gets squeezed out. It might run super slowly or even crash if it’s starved. This means our monitoring and alerting system is effectively neglected. It’s there “watching,” but it can’t do its job. In the image, Prometheus is kneeling and gazing up sadly at the other two – exactly how a sidelined monitoring system feels when nobody configures the cluster with observability in mind. The background characters blurred out could be other neglected tools or just to focus our attention on this love triangle. Essentially, the meme is saying: if you let your microservices hog all the cluster’s power without restraint, your monitoring will be left out in the cold. That’s a common DevOps lesson – always ensure your MonitoringSystems (like Prometheus) have the resources they need, or you’ll be flying blind when things go wrong.

Level 3: Observability Friendzoned

In this meme’s anime-style dramatization, microservices are passionately “embracing” all the Kubernetes cluster resources (CPU, memory) while poor Prometheus kneels nearby, longing to be included. Technically speaking, this is a tongue-in-cheek portrayal of a ResourceManagement fiasco in container orchestration: the services are greedily consuming every CPU cycle and byte of RAM in the K8s cluster, and the monitoring system (Prometheus) is left helpless and ignored. It’s funny because it hits on a real DevOps antipattern — teams obsess over scaling their apps (the my services fervently loving more CPU and memory) but neglect observability (Prometheus ends up friend-zoned, desperately watching but unable to intervene).

From a senior DevOps/SRE perspective, this scenario is painfully relatable. Kubernetes will happily let your pods gobble resources if you don’t impose limits. Those k8s cluster resources being hugged in the meme represent the cluster’s finite CPU cores and RAM. Without properly set requests and limits in your Deployment specs, each microservice can act like a greedy lover at an all-you-can-eat buffet, consuming far more than its fair share. The humor is that Prometheus, which is supposed to keep watch on these services, is starving for resources itself — essentially observability is being friend-zoned by the very apps it’s meant to monitor. We’ve all seen this in real life: a swarm of microservices promised to be lightweight ends up hogging entire nodes, while monitoring and logging agents get throttled or evicted. The result? The one component that could alert you to the impending doom (high load, memory pressure) has been sidelined. It’s like disconnecting the smoke alarm because the stereo and TV are using all the power; when a fire starts, the alarm’s batteries are dead. So there you have it: a ScalabilityIssue where microservices scale unchecked and Observability goes out the window, captured in a single melodramatic sketch. The meme exaggeration works because it’s built on truth: if you configure resource limits poorly (or not at all), your MonitoringSystems will be the first to suffer, quietly kneeling in the corner while the cluster burns with high load.

Description

This is a black-and-white, anime-style sketch meme that personifies a common DevOps scenario. In the center, two characters are passionately kissing. The character on the right, with long dark hair, is labeled 'my services'. The character on the left, being embraced, is labeled 'k8s cluster resources'. This embrace visually represents an application or service consuming all available resources within a Kubernetes cluster. To the lower right, a smaller, child-like character with braided hair nonchalantly sips a drink through a straw, watching the scene unfold. This character is labeled 'Prometheus'. The technical joke is that Prometheus, a widely used monitoring and alerting tool, is designed to observe and report on system metrics like resource utilization. The meme humorously portrays Prometheus as a passive, almost voyeuristic observer, simply watching the user's services devour the cluster's resources without intervention. This is relatable to any engineer who has watched their monitoring dashboards show a system heading towards failure, with the monitoring tool just documenting the disaster in real-time

Comments

8
Anonymous ★ Top Pick My services and k8s resources are in a co-dependent relationship, and Prometheus is the friend who just watches the drama unfold, quietly sipping its tea and thinking 'this is fine, it's just metrics'
  1. Anonymous ★ Top Pick

    My services and k8s resources are in a co-dependent relationship, and Prometheus is the friend who just watches the drama unfold, quietly sipping its tea and thinking 'this is fine, it's just metrics'

  2. Anonymous

    When every deployment ships with “requests: 2 CPU, limits: ∞” and you gave Prometheus a nice-to-have priorityClass, observability becomes an eventual-consistency fairy tale

  3. Anonymous

    When you realize your Prometheus setup is using more memory than the actual services it's monitoring, and your k8s cluster is basically running a very expensive metrics collection system with a small side business of serving actual traffic

  4. Anonymous

    When you architect a beautiful microservices ecosystem on Kubernetes, only to realize your Prometheus instance is now spending more CPU cycles scraping metrics than your actual services are doing work. The classic observability paradox: you can't fix what you can't measure, but measuring everything means there's nothing left to fix because all your resources are consumed by the observer effect. At least when Prometheus inevitably OOMs, you'll have detailed metrics of its own demise - assuming you set up meta-monitoring, which of course requires another Prometheus instance

  5. Anonymous

    Amazing how every pod gets 2 vCPU and 8Gi by default, but when Prometheus asks for 500m and 10Gi TSDB we call it “cost optimization” - right up until the 2 a.m. page asking why there were no metrics

  6. Anonymous

    Nothing says “mature platform” like giving apps Guaranteed QoS to hug all the millicores, leaving Prometheus BestEffort and throttled - then wondering why alerts show up right after the postmortem

  7. Anonymous

    My services found love, but Prometheus won't stop federating their every heartbeat metric

  8. @QutePoet 4y

    Hard power joke.

Use J and K for navigation