Skip to content
DevMeme
1623 of 7435
GitHub Contribution Graph as a Measure of 'Winning'
DeveloperProductivity Post #1814, on Jul 30, 2020 in TG

GitHub Contribution Graph as a Measure of 'Winning'

Why is this DeveloperProductivity meme funny?

Level 1: Sticker Chart

Imagine you have a big calendar at home, and every day you do your homework or chores, you get to put a shiny sticker on that day. You start to feel proud watching a whole week fill up with stickers, and then two weeks, and then a month with no gaps. It’s like a game where the goal is to not break the chain of stickers. Now, in this picture, the dad has something kind of like that, but for his work. Instead of stickers, he gets little green boxes on his computer screen for each day he wrote some code. When his child peeks in and asks, “Are you winning, Dad?” it sounds like the kid is asking if he’s winning a video game. The funny part is that the dad isn’t playing a normal game at all – he’s writing code – but he still says “Yes” because to him, filling all those green boxes feels like winning. He’s looking at his screen full of green squares the same way a kid might look at a chart full of gold star stickers and feel really accomplished. In simple terms, the dad made progress every single day, and seeing that progress visualized (all those boxes with no days missed) makes him as happy as winning a game. It’s cute and funny because the kid doesn’t realize that grown-ups also like to give themselves little “points” or rewards, even for work. The dad is basically treating his work milestones like a high score, and he’s really proud of not missing a day. So when he says he’s winning, he means he set a personal goal and he’s achieving it – and that little grid of green squares is his way of keeping score.

Level 2: Commit Streak Scoreboard

Let’s break down what’s happening in this meme for those newer to the coding scene. In the images, a little girl asks her dad if he’s “winning.” This is a reference to a popular meme format where someone checks if you’re winning at whatever you’re doing. Here, the dad isn’t playing a video game at all – he’s sitting in front of a computer, working on code. What the child doesn’t realize is that her dad does have a kind of score: the green grid on his screen. That screen is showing a GitHub contribution graph (sometimes jokingly called the GitHub “heatmap” or scoreboard for developers). GitHub is a platform where developers store and collaborate on code using Git, which is a version control system. Version control like Git helps programmers track changes in their code over time, kind of like an undo/redo system but for entire projects, and it allows multiple people to work together without messing up each other’s changes.

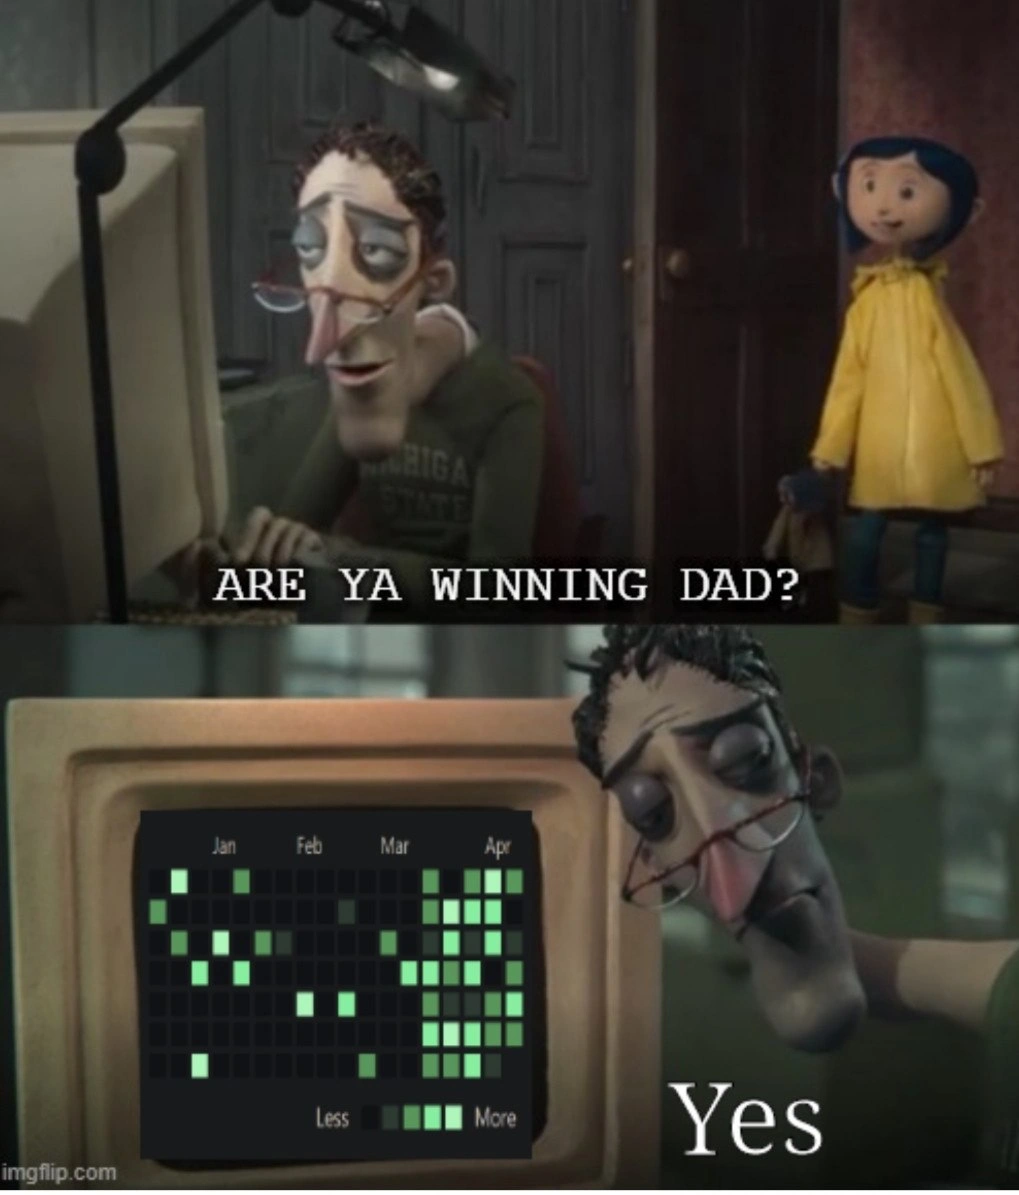
Now, about that green grid: each small square represents a day on the calendar. If the square is gray or very light, it means few or no code contributions happened that day. If it’s green, it means the user made some contributions (like committing code to a repository). The more contributions on that day, the darker the green of the square. In the meme’s second panel, the monitor shows months (“Jan”, “Feb”, “Mar”, “Apr”) labeled along the top, and a legend at the bottom from “Less” to “More” – indicating lighter green to darker green. This is exactly how GitHub visually represents your activity. So, when dad’s screen is filled with green squares, it means he’s been consistently active, writing code and pushing those changes to GitHub almost every day.

What’s a commit? A commit is essentially a save point or snapshot of your project in Git. Whenever Dad makes changes to his code – maybe fixing a bug or adding a new feature – he creates a commit with git commit. This records the changes along with a message describing what he did. When he uploads (pushes) these commits to GitHub, GitHub counts that as a contribution. If Dad does this every single day, he builds up a commit streak – which is the number of consecutive days he has contributed. For example, if he committed code for 30 days straight without missing a day, that’s a 30-day commit streak. It’s like not missing a single day of practice or homework for a whole month.

Developers, especially those active in DevCommunities online, sometimes take pride in having a long commit streak. It’s a visible indicator of continuous work or learning. Imagine opening your GitHub profile and seeing a big block of green covering the last few months – it feels like a trophy case where each square is a trophy for that day. This can become a bit of a game: “How long can I keep the streak going?” There’s even friendly competition and TechHumor around it. People joke about committing something trivial on a Sunday night just so that their streak doesn’t break on the calendar. It’s not that the number of commits is directly equal to real productivity, but it feels motivating. Each green square can give a tiny rush of accomplishment. Psychologically, it’s similar to checking off a daily to-do list or hitting a step count goal – your brain enjoys the streak. That’s why we mention dopamine: it’s the chemical associated with the pleasure of achieving small goals. The term dopamine-driven metrics refers to things like streaks or scores that make you feel good and want to continue the behavior.

The humor in the meme comes from treating this commit streak like a video game win. The child expects the father might be playing and winning a game on the PC. Instead, the “game” is just Dad doing coding work day after day. When he proudly says “Yes” to being winning, it’s funny because, to a non-developer, that green grid means nothing. But to a developer, a fully filled-in contributions graph does feel like a win. It means you’ve been coding consistently (perhaps pouring hours into a project or learning every day). It’s a form of DeveloperProductivity bragging right, albeit a light-hearted one. In reality, of course, writing good code isn’t about the number of commits or keeping a streak unbroken. Quality matters more than quantity. But developer culture often treats these little milestones as motivation. For a junior developer, this is a rite of passage: you’ll likely catch yourself smiling the first time you see a whole week of green squares on your profile, or a month where you “didn’t miss a day.” And then you’ll get the joke – we know it’s a bit silly to equate that to winning, but it’s encouraging and fun.

So, in summary: Dad’s “win” is that his GitHub contribution graph is fully green for several months (Jan through Apr on the image). He’s essentially saying, “Look, I’ve been coding every day – I haven’t missed a single day, and I’m proud of that.” The meme jabs at how developers sometimes measure success in quirky ways like commit counts or streaks. It falls under DeveloperHumor and VersionControlHumor because it uses the tools and habits of coding (Git, GitHub, commits) as the basis of the joke. The scene is relatable if you’ve ever been deep in code for days on end. And if you’re new: don’t worry, you don’t actually have to commit every day to be a good developer! This is just a funny exaggeration of how some of us motivate ourselves. The green squares are a bit like a scoreboard, and seeing them fill up scratches the same itch as leveling up in a game. In the end, the kid in the yellow raincoat doesn’t really get it – but the developers looking at this meme sure do, and we’re chuckling in solidarity.

Level 3: Green Square Dopamine

In the world of software development, even version control can turn into a high-score game. This meme nails a truth that seasoned devs know all too well: those little green squares on your GitHub profile can feel like an addictive scoreboard. The top panel sets the scene with a weary, code-crunched dad at an old beige CRT monitor. His child innocently asks, “ARE YA WINNING, DAD?”—a line borrowed from the classic are_ya_winning_meme format. The twist is that Dad isn’t battling monsters or racing cars; he’s pushing code. When the second panel reveals his euphoric face basking in the glow of a fully loaded github_contribution_graph, the punchline drops. He softly answers, “Yes,” as if hitting a commit streak is equivalent to beating the final boss. It’s DeveloperHumor gold because so many of us have been that tired developer deriving irrational joy from a perfectly green commit streak calendar.

On a surface level, it’s poking fun at DeveloperProductivity metrics. In many DevCommunities, maintaining a relentless streak of daily code commits is worn like a badge of honor. That grid of squares ranging from light to dark green quantifies our activity: commit more and watch the color deepen. Objectively, we know it’s a vanity metric (much like counting lines of code), but emotionally… oh boy. Seeing those consecutive green days triggers a dopamine_driven_metrics loop: each square is a tiny reward, a hit of “Yes, I did something!” to the brain. It’s gamification at work. GitHub didn’t necessarily intend the contribution graph to be a game, but developers turned it into one. We joke about “watering the green GitHub lawn” or keeping the streak alive at all costs. Some devs have literally scripted Git to auto-commit empty changes daily just so their streak doesn’t break. One could git commit --allow-empty -m "Keeping the streak alive" at 11:59 PM as a cheeky way to get that square. It’s the programming equivalent of sneaking in homework right before midnight to keep a perfect record.

The humor cuts deeper when you notice why the dad looks so exhausted in panel one. The character is from Coraline (a stop-motion film), depicted as a drained father working late. For developers, that image hits home: late nights, bleary eyes, hunched posture—the RelatableDevExperience of being burnt out but still chasing some arbitrary goal. The meme mashes that up with the absurdity of commit-streak obsession. It’s a satire of how our industry sometimes reduces “winning” to raw activity metrics. We laugh (perhaps a bit nervously) because we’ve seen developers, or ourselves, conflate an unbroken commit_streak with actual success. Sure, you pushed code 300 days this year, but are you actually more accomplished, or just unable to take a day off? The meme’s father figure answers “Yes” with such serene satisfaction that it highlights this collective delusion. It’s a gentle roast of our tendency to seek validation through green squares when more meaningful measures (like code quality or work-life balance) are harder to visualize.

There’s an undercurrent of VersionControlHumor here too. In theory, using Git (a distributed version control system) is about collaboration, backups, and managing code history. But leave it to developers to turn a VersionControl tool into a competitive sport. It’s funny because it’s true: we compete over GitHub contribution graphs the way kids compare video game scores. Remember the “longest streak” counter GitHub used to display? People would brag about streaks stretching hundreds of days. It got to the point where GitHub toned down the streak emphasis, subtly acknowledging that maybe this commit-count contest had gone too far. The meme embraces that history: shipping lots of commits is depicted as “winning” the game of coding. It’s an inside joke about DevCommunities culture—one that newcomers eventually stumble upon when they notice colleagues light up at a wall of green squares or despair when a streak resets.

Ultimately, the meme delivers a relatable punch: in tech, “productivity” often gets gamified. We’re laughing at the dad’s childlike glee because we see ourselves. Whether it’s hitting a GitHub streak, accumulating Stack Overflow reputation, or collecting Jira story points, developers find ways to keep score. This dad’s victory grin says, “I might be dead-tired, but look at my commit streak – I’m on fire!” The comedic irony is that his kid just wanted to know if he was winning a game. In a sense, he is – just not one the kid understands. The meme highlights how developers sometimes measure progress in quirky ways, finding wins in the grind of writing code. It’s both a celebration and a light critique of that DeveloperProductivity culture: we know those green squares don’t tell the whole story, but hey, let us have this small win. After all, in the continuous integration of life, sometimes a streak is the only trophy you get.

Description

A two-panel meme using the 'Are ya winning, son?' format, but with characters from the movie Coraline. In the top panel, Coraline stands in a doorway and asks her exhausted-looking father, who is slumped over a computer, 'ARE YA WINNING DAD?'. The father appears tired and disheveled, wearing a Michigan State sweatshirt. In the bottom panel, the father leans his head against the monitor, which displays a GitHub contribution graph. The graph shows consistent activity, with many green squares indicating commits, particularly in March and April. The father replies with a simple, 'Yes'. This meme equates 'winning' in life or career with maintaining a busy GitHub commit history, a common pressure felt by developers to be constantly coding and visibly productive. It satirizes the hustle culture in tech and the use of metrics like contribution graphs as a proxy for success, even at the cost of personal well-being

Comments

7
Anonymous ★ Top Pick Are you winning? Yes, my CI pipeline is green, my test coverage is over 90%, and my GitHub graph looks like a flourishing garden. Now, please don't ask about my serotonin levels
  1. Anonymous ★ Top Pick

    Are you winning? Yes, my CI pipeline is green, my test coverage is over 90%, and my GitHub graph looks like a flourishing garden. Now, please don't ask about my serotonin levels

  2. Anonymous

    “Yep, son - 70 straight green squares, all midnight ‘docs: fix typo’ commits; in the scoreboard capitalism of GitHub, that’s practically an MVP trophy.”

  3. Anonymous

    After 15 years in the industry, you realize the real CI/CD pipeline is Commit Incessantly/Contribution Display - because nothing says 'senior engineer' like treating your GitHub graph like a pixel art project while your actual PRs are all dependency bumps and README typos

  4. Anonymous

    The real question isn't whether you're winning, Dad - it's whether those April commits are actual features or just frantically fixing the technical debt you accumulated in Q1 before the board review. That contribution graph tells a story: January's optimistic 'new year, new architecture,' February's reality check when you realized the monolith won't refactor itself, and March-April's desperate sprint to make it look like you've been productive all quarter. At least your GitHub graph is greener than your production monitoring dashboard

  5. Anonymous

    GitHub streak unbroken: high-availability commits with zero-downtime tolerance, SLA violated on personal sanity

  6. Anonymous

    Yes - my most reliable service is a 23:59 cron that touches README; nothing like a greener GitHub lawn to make months of invisible architecture work look “winning.”

  7. Anonymous

    Yes - DORA unchanged, but the GitHub heatmap is SRE green thanks to a nightly 'refactor: whitespace' cronjob; Goodhart would be proud

Use J and K for navigation