
Flat Earth's Final Proof: The Travelling Salesman Problem
Description
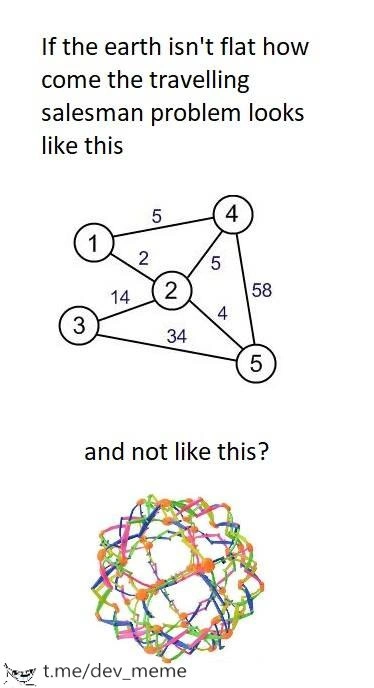
A two-part meme that humorously connects computer science theory with conspiracy theories. The top panel poses the question, 'If the earth isn't flat how come the travelling salesman problem looks like this'. Below the text is a simple, two-dimensional, planar graph with five numbered nodes (1-5) connected by edges with various numerical weights (e.g., the path from 3 to 5 is 34, from 4 to 5 is 58). The bottom panel asks, 'and not like this?', followed by an image of a complex, colorful, and chaotic three-dimensional spherical mesh of interconnected nodes and lines. The meme's joke lies in its absurdly literal interpretation of a theoretical model. It pretends that the simplified 2D graph used to teach the NP-hard Travelling Salesman Problem in computer science is a literal representation of the world, thereby 'proving' the Earth is flat. It's a satirical jab at flawed reasoning, appealing to engineers who understand that models are abstractions of, not replacements for, reality



Comments
7Comment deleted
The problem isn't that the graph is 2D; the problem is that the salesman is trying to visit 50 cities, and management wants the optimal route by EOD. I'll take a flat earth over those constraints any day
PO: “If the Earth is round, why is the TSP demo flat? Let’s render it on a globe.” Me: “Sure - right after I swap Euclidean weights for great-circle distances and ask finance for the ‘quantum annealing’ line item.”
After 20 years of optimizing TSP algorithms, I finally realized why my solutions never matched real-world delivery times - turns out UPS drivers don't traverse a planar graph, and Dijkstra never accounted for construction zones, coffee breaks, or that one package that requires a signature from someone who's perpetually 'just stepped out for 5 minutes.'
The joke brilliantly exploits the fact that most TSP examples use planar graphs for pedagogical clarity, when real-world instances - especially on a spherical Earth - create hideously non-planar graphs with O(n²) edges. It's the algorithmic equivalent of discovering your 'simple' microservice architecture diagram actually looks like a Kubernetes cluster after three years of organic growth. The irony? Flat-earthers accidentally stumbled onto P vs NP: if only the world were flat, maybe TSP would be tractable
We draw TSP on a plane because the cost matrix already encodes the geodesics - switch to great‑circle distances if you like, it still projects NP‑hard onto your sprint board (LKH + prayer)
Textbook TSP: clean flat graph, 'elegant' O(2^n). Globe edition: that colorful knot where heuristics pray for 5% optimality
Because the salesman optimizes a metric, not a manifold; we draw straight lines for the same reason PMs draw straight roadmaps - Mercator in the deck, Haversine in prod, and NP-hard all the way