Skip to content
DevMeme
4086 of 7435
ELK stack sprouts antlers, yet someone still pleads “idk I’m not devops”
Observability Monitoring Post #4454, on Jun 14, 2022 in TG

ELK stack sprouts antlers, yet someone still pleads “idk I’m not devops”

Why is this Observability Monitoring meme funny?

Level 1: Not My Job

Imagine you have a big messy playroom where all your toys are scattered around. Now, mom sets up a special shelf where every type of toy has its own labeled box – one for LEGO blocks, one for crayons, one for action figures, etc. This shelf is super helpful because when you need your red crayon, you can go straight to the “Crayons” box and find it quickly. Setting up that shelf with the boxes is a bit like what the ELK stack does for computer logs: it collects lots of messy information from everywhere and organizes it so people can find what they need later.

Now, let’s say there’s a kid (we’ll call him Dev) who was playing and left toys all over the floor. Another kid, Ops, built that neat shelf system to organize everything. Later, someone asks Dev, “Hey, do you know where the red crayon is? We really need it!” Dev just shrugs and says, “There’s some shelf or something for toys, I dunno. I’m not the cleanup crew.” That’s basically what the meme is showing, except with an elk instead of a shelf. The elk in the picture is carrying all the tools (like that shelf with boxes) that organize the “toys” (in real life, logs and data). And the caption is the Dev kid saying, “ELK stack or something, idk I’m not devops,” which is like saying, “Yeah, there’s an elk carrying all that stuff, but don’t ask me how it works – I don’t do that job.” It’s funny because the elk with antlers full of boxes (or in the real case, logos and data) is so obvious, yet the person speaking pretends it’s not their responsibility to deal with it.

In simple terms, the meme is joking about someone not wanting to clean up or organize the mess they helped make. It’s as if a student made a mess in class and when the teacher asks about it, the student points to the janitor’s closet and goes, “There’s a broom or something, I dunno, cleaning isn’t my job.” We laugh because it’s a silly excuse – the big elk (or the big shelf of tools) is right there to help, but the person just doesn’t want to get involved.

So, the big deer (elk) with all the tech logos on its antlers is a punny way to show a complicated tool named “ELK.” And the text is someone saying they don’t understand it because it’s not their job. It’s funny in the way it’s funny when someone says “Not my problem!” about a problem that is obviously in front of them. Even a kid can see the big deer carrying stuff and think, “How can you miss that? It’s right there!” That obviousness is the joke. In real life, it reminds us that saying “not my job” can be a bit silly when the solution is sitting right in front of you (or on an elk’s antlers!).

Level 2: The Elk in the Room

Let’s break down exactly what we’re seeing in this meme and what all these terms mean, especially if you’re newer to logging or DevOps. The meme centers on the ELK stack, which is a popular combination of tools used in software engineering for logging and observability. ELK stands for:

  • Elasticsearch – a search engine/database that stores and indexes log data (and other types of data) so you can query it quickly.
  • Logstash – a data processing pipeline tool that takes in logs (and other events), possibly cleans or transforms them, and then sends them to storage (often into Elasticsearch).
  • Kibana – a web UI (User Interface) for visualizing data in Elasticsearch. It lets you search logs, view charts, and build dashboards to monitor what’s happening.

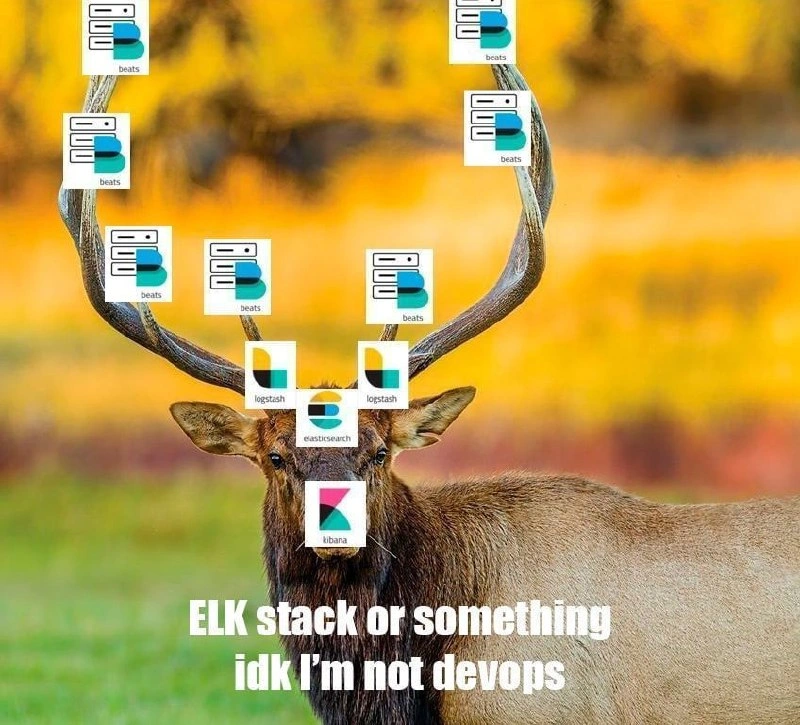
Originally, those three made up “ELK”. Later, the company Elastic (which develops these tools) added Beats to the ecosystem, so sometimes people say “Elastic Stack” instead of ELK stack nowadays. Beats are a family of lightweight data shippers – basically, little programs that live on servers and send data to Logstash or Elasticsearch. For example, Filebeat is a Beat that tails log files and ships new log lines out, and Metricbeat collects metrics (CPU, memory info, etc.) and ships those. In the meme’s image, the Beats logo (a blue stylized “B”) is repeated along the elk’s antlers, representing multiple Beats instances gathering data from various places. You’ll notice small server icons on those Beats logos too – that indicates each Beat might be running on a different server, each one grabbing that server’s logs.

Now, why an elk (the animal)? It’s a pun! Because “elk” is an actual animal, but in tech ELK is this stack of tools. So the meme creator took a photo of a literal elk and decorated it with the ELK stack components. It’s visual wordplay. The elk’s antlers are long and branchy, and the creator placed a series of Beats logos up each branch. This makes the antlers look like pipelines of data going upward. At the point where the antlers meet the elk’s head, you see the Logstash logo on one side and the Elasticsearch logo on the other, implying those Beats are sending data into Logstash/Elasticsearch at the top. Finally, right on the elk’s nose there’s the Kibana logo, suggesting that Kibana is the “face” or the end interface of this whole setup. It’s a pretty clever representation: each part of the ELK stack is positioned in the order data flows through it – data originates at the tips (Beats collecting logs from sources), flows into a processor (Logstash, at the base of antlers), is stored in a database (Elasticsearch, near the head), and then is viewed through a tool (Kibana, at the nose).

The big caption text on the meme says: “ELK stack or something idk I’m not devops.” Let’s unpack that. “idk I’m not devops” is internet-speak for “I don’t know; I’m not DevOps.” In many companies, DevOps (or Site Reliability Engineering, SRE) refers to the role or team that sets up and manages infrastructure, deployment, and monitoring. When someone says “I’m not DevOps,” they mean “I’m not the one who deals with servers or logs or deployment – that’s not my role.” It’s like if in a school project one student was responsible for art and another for writing, the writer might say “Don’t ask me about drawing the poster, I’m not the art person.” Here, a developer is basically saying, “Don’t ask me about the ELK stack or logging; that’s not my area.” The phrase “ELK stack or something” shows they’re vaguely aware the company uses ELK for logs, but they’re not confident or invested enough to talk about it.

So the humor is partly that someone is using this elaborate system (the ELK stack) yet acting like it’s a mysterious creature (the elk) they can’t tame. It’s like saying, “Yeah, there’s some magic logging thing (maybe called elk?) happening, but I have no idea – I’m just a coder.” If you’re new: this reflects a scenario where developers might not involve themselves in how logging and monitoring work, leaving it to specialized DevOps engineers. The meme is gently poking fun at that separation. It’s underlining the idea that observability tools (like ELK) are extremely important and present — basically “in the room” (hence our subtitle “The Elk in the Room”) — but some people ignore them or pretend they can’t understand them because it’s not their specific job. We often use the phrase “elephant in the room” to mean an obvious thing people aren’t talking about; here we have an “elk in the room” which is an obvious logging system that someone is pointedly not taking responsibility for.

To give more context on observability: Observability and Monitoring (as per the categories and tags) is all about being able to see what’s going on inside your software systems. Logs are one major part of that (alongside metrics and traces). The ELK stack became a very popular solution for logs because it’s open-source and flexible. Instead of manually logging into servers and reading log files line by line, ELK lets teams centralize all logs in one place (Elasticsearch) and search them easily (via Kibana’s UI or Elasticsearch’s API). For example, if a web service has an error, you can go to Kibana and search for error messages or filter by that service and timeframe, rather than opening dozens of files. Beats and Logstash handle the heavy lifting of getting those log lines from where they are generated (say /var/log/app/error.log on a server) into that central database.

Let’s clarify each component in simpler terms:

  • Beats: Little collectors. Think of them as messengers running on each machine, whose job is to pick up new logs as they appear and deliver them to the central system. If each server is a neighborhood, a Beat (like Filebeat) is the postman picking up mail (logs) from houses and bringing it to the post office.
  • Logstash: The organizer. At the post office analogy, Logstash is like the sorting room or the mail sorter machine. It takes the incoming mail (logs from all the Beats), opens them up, filters or repackages them (maybe throwing away spam or tagging each letter with a zip code), and then forwards them to the right place. It ensures everything is in a consistent format and maybe does things like put timestamps in a standard form, or add labels like “severity: ERROR” if certain words are present.
  • Elasticsearch: The storage and search engine. Continuing the analogy, Elasticsearch is like a giant, well-organized library or archive where all the mail (logs) ends up. Instead of storing letters by date in one huge pile, it indexes everything by keywords, so you can quickly find all letters that mention “payment” or retrieve all error logs from March 10th, for instance. It’s built so that even if you have a ton of logs (millions or billions of entries), you can still search through them relatively quickly. It runs on a cluster of servers so it can handle a lot of data and queries at the same time.
  • Kibana: The viewer and analyst. This is like the librarian or the interface that helps you query the library. Kibana provides a nice GUI so you don’t have to write complex search queries by hand (though you can). You might type in a search bar “error AND user:JohnDoe” or use dropdowns and timepickers to filter logs from the past hour, etc. Kibana also lets you see charts – like how many errors per minute, or a pie chart of log severity levels – which help you spot patterns and anomalies.

In the meme image, all these tools are stuck onto parts of the elk to visualize that they are connected: Beats (many of them) feed into Logstash/Elasticsearch, and Kibana sits on top to view it all. The caption’s person clearly doesn’t want to deal with any of that; they label it “ELK stack or something” and disqualify themselves by “not devops.” This is commonly seen when a developer might say, “Oh, the logs are in Kibana. I guess it’s stored by Elastic...something something. But I don’t really use it, ask DevOps.” It highlights a knowledge gap: they know the stack exists, but they haven’t engaged with it. For a junior developer reading this, the takeaway is that ideally, you shouldn’t shy away from learning these tools! They might seem like “DevOps stuff,” but they’re super useful for debugging your own applications.

The meme is tagged with things like #Logging, #MonitoringSystems, #ObservabilityAndMonitoring, which confirms it’s making a joke about those domains. It also has #DevOpsHumor and #not_devops_excuse, emphasizing it’s a light-hearted take on the interaction between devs and ops. If you’re in a junior role: imagine you wrote some code, it ran on a server, and something went wrong. The logs (text records of what your code did, errors it encountered, etc.) are the first clues to figure out the issue. The ELK stack is like a centralized detective’s office for all those clues. Brushing it off as “not my department” could be problematic – it’s like a detective saying “I don’t read clues, that’s the evidence custodian’s job.” The meme is funny because the person saying “I’m not DevOps” is kind of doing exactly that – ignoring the obvious clues (and the majestic elk carrying them).

So in summary at this level: The meme plays on the pun of an elk representing the ELK logging stack, and the caption jokes about someone distancing themselves from dealing with that stack because it’s “DevOps stuff.” It resonates in tech teams because sometimes developers and ops have a divide, each thinking the other handles certain problems. This meme gently ribs those who could learn a bit more about the tooling but choose to remain blissfully ignorant. And even if you’re new and don’t fully get all the tools yet, the image of an elk proudly carrying all the logging components is memorable – it says “observability is here,” even if one might jokingly say “not my problem.”

Level 3: The Buck Doesn’t Stop Here

At this level, we explore why engineers find this meme painfully accurate and funny. The image is a classic wordplay: an elk (the animal) visually representing the ELK stack (the logging and observability suite of Elasticsearch + Logstash + Kibana, plus Beats) by literally sprouting those tool logos on its antlers. The caption drives home the joke: “ELK stack or something idk I’m not devops.” This is a tongue-in-cheek jab at the often-heard excuse from developers who don’t want to deal with deployment or infrastructure issues. Essentially, someone is shrugging off responsibility for understanding the log system, waving at the complicated observability tools and saying, “I don’t really get that stuff, I’m not a DevOps person.” It’s funny because it’s a shared trope in tech teams: the moment logs, monitoring, or anything vaguely “operations” related comes up, certain team members throw up their hands as if it’s a foreign world – even if their code is precisely what’s producing those logs.

In real-world software teams, especially those that haven’t fully embraced the "you build it, you run it" DevOps mentality, it’s common to see a divide: developers write the application, and a separate DevOps/SRE team manages deployment, logging, and monitoring. The meme pokes fun at this silo. The developer (or whoever “not devops”) is effectively saying, “Look, there’s an ELK stack doing something with logs, but I have no idea and don’t want to know – that’s someone else’s problem.” For any Senior Engineer or SRE who’s been on the other side of that statement, it’s a mix of eye-rolling humor and mild frustration. We’ve all been in that war room or on that Zoom call where a critical bug is happening in production, and when someone asks “What are the logs saying?” a developer might reply, “Uhh, ELK is collecting them I guess? I’m not sure how to check – I’m not the DevOps guy.” Meanwhile, those logs (which the dev’s own code is generating) are the key to solving the issue. The buck gets passed along – hence the subtitle “The Buck Doesn’t Stop Here.” The phrase “the buck stops here” means taking responsibility, but in this scenario the “buck” (or rather the elk) is being passed off: the dev is definitely not stopping any bucks today! This wordplay is extra delicious because a male elk is often colloquially called a buck, so literally the “buck” (elk) is not stopping with that person. Instead, it’s roaming free (or crashing into the on-call engineer’s pager).

The humor also lies in the absurd literalism: some clueless soul sees an actual elk with Beats devices on its antlers feeding into Logstash and Elasticsearch – a ridiculously literal elk stack in the wild – and their reaction is basically a shrug: “ELK stack or something, I dunno.” It’s like they recognize just enough to use the buzzword (ELK stack) but confess total ignorance right after. This captures a real dynamic in tech workplaces: people using jargon they’ve heard (“We have Elk for logs, right?”) without truly understanding it (“Some elk... or whatever, I’m not ops”). It’s the equivalent of saying, “Yeah, we put it on Kubernetes or something, I’m not DevOps so whatever.” To those in the know, it’s both funny and exasperating. Funny, because the image is so on-the-nose (literally putting Kibana on the elk’s nose) about how obvious the ELK stack is to anyone dealing with logs. Exasperating, because we’ve met that person who treats critical infrastructure as a magical black box maintained by others.

By placing the Kibana logo on the elk’s nose, the meme artist cleverly emphasizes the “front end” of the ELK stack. Kibana is what people think of when they need to look at logs or metrics – it’s the dashboard you actually open in your browser. So even a dev who “is not DevOps” might recall, “We have Kibana, right? That’s where logs live.” But they might not know how data gets there (the Beats and Logstash parts along the antlers). The Beats logos on the antler tines, arranged in a chain, look like a pipeline feeding into Logstash, then Elasticsearch (whose logo appears near the head). This mirrors how in real setups, you might have a chain of data: e.g., Filebeat on each server tails the application log and sends entries to a Logstash pipeline, which then feeds Elasticsearch. The far ends of the antlers could even represent different servers or microservices all shipping logs. A senior engineer will notice this and chuckle at how neatly the wildlife photo has been repurposed into an architecture diagram. It’s both pretty and pretty accurate! Meanwhile, the caption’s speaker apparently just sees a fuzzy concept of “logs going somewhere in ELK” and distances themselves from it.

The meme is categorized under Observability_Monitoring and DevOps_SRE for good reason. It satirizes the world of logging and monitoring systems, where tools like Elasticsearch and Kibana are staples. If you’ve ever been responsible for uptime, you know that getting those tools set up correctly is vital. Logs can be a lifeline when debugging an outage – they’re often the first place you look when something goes wrong in production. The joke’s scenario probably resonates with SREs: imagine you’re on call, something’s on fire (maybe a high-severity incident), and you ask the developer of the feature “What do the logs say when the error happens?” If their response is “Well, we have an ELK stack or something, but I don’t really know how it works. I’m not the DevOps person,” you’d facepalm internally. The image of a majestic elk doesn’t exactly comfort you as you’re scrambling to find the logs yourself in Kibana while the dev stands by clueless. The observability overload is on you because someone shrugged it off. It’s a scenario many in DevOps have faced: the observability tools are there (represented by this giant elk with impressive antlers of data), but the people who could leverage them don’t bother learning how. The result? The poor SRE or DevOps engineer ends up digging through dashboards alone, much like a lone ranger tracking an elk through the forest at night.

We also see a bit of tooling humor here. The ELK stack is powerful but can become overkill or overwhelming if you’re not familiar with it. It’s not uncommon for a junior dev or someone outside the ops team to simply perceive it as this giant beast roaming in the background. They know it’s there and it’s called “elk” something, but if you asked them to, say, add a new log field and make it searchable in Kibana, they’d panic or defer to DevOps. The meme text “idk I’m not devops” encapsulates that deferment. In a way, the non-DevOps person in the meme is conflating DevOps with knowing how to handle the ELK stack. It hints at a misconception: “Only DevOps people need to know about logging or monitoring.” In modern DevOps culture, that’s not really true – developers are encouraged to have ownership of their code in production, which means reading logs, setting up alerts, etc. But clearly that culture hasn’t reached this meme’s protagonist. The humor bites a bit here: if you identify with the SRE side, you laugh at how accurately this depicts the excuses; if you identify with the clueless dev side, you might laugh nervously and think, “Heh, I should probably learn that ELK thing.”

Another layer of humor is simply the visual pun and how over-the-top it is. The elk photo is high-resolution, majestic autumn backdrop, with these corporate logos slapped on in a deliberately silly fashion. The Elastic Beats logo appears multiple times on each antler branch, almost like the elk grew computer stickers instead of velvety points. It’s absurd – an elk carrying an entire monitoring pipeline on its head! The phrase “ELK stack sprouts antlers” from the title is joking that the stack itself grew horns (even though actually it’s the animal that has them). For seasoned developers, the absurdity makes it memorable: you’ll never forget that Beats feed logs into Logstash when you’ve seen them literally feeding down an elk’s antlers. It’s a bit of Rube Goldberg imagery for something actually quite routine in backend infrastructure. The caption’s casual “or something” further adds to the comedic tone – it’s the kind of thing someone says when they’ve heard of a thing but couldn’t be bothered to get it right. “Yeah, yeah, ELK stack, ELK deer, whatever... I’m not DevOps.” We’ve all had that one colleague who manages to both reference a tool and disown knowledge of it in one breath. This meme calls that out with perfect comedic deadpan.

In essence, the meme is funny to developers and SREs because it perfectly mixes a tech pun with a cultural reality. The pun: ELK (software) = elk (animal with antlers). The cultural reality: the habit of throwing one’s hands up at ops issues. It gets a smirk because the one-liner “idk I’m not devops” is such a mood – a sarcastic mood, often quoted to tease team members who dodge responsibility. It’s likely become a small catchphrase in some circles to jokingly refuse to answer a question (“Don’t ask me about Jenkins, idk I’m not DevOps” 😂). The meme creator knew their audience: folks who work with monitoring and have experienced cross-team ignorance. By using the common tags like #DevOpsHumor and #MonitoringSystems, they aimed this at all the on-call engineers who’ve wrestled with complex log setups while someone else stood by claiming ignorance. The laugh comes with a side of “yep, been there.”

Level 4: Antlers of Aggregation

At the deepest technical level, this meme hints at the complex architecture of log pipelines by visualizing an actual elk with logos on its antlers. Each tine on the elk's antlers bears the Beats logo, symbolizing multiple data shippers (like Filebeat, Metricbeat, etc.) feeding streams of log data from various sources. In a real production system, dozens of Beats agents might be installed across servers, each one tailing log files or capturing system metrics, then forwarding those events down the “antlers” into a central pipeline. The branching antlers convey how log sources fan-in from many origins. These individual streams converge at the elk’s head where the Logstash and Elasticsearch logos sit, representing the aggregation point where data is collected, processed, and indexed. It’s a playful nod to the directed acyclic graph of data flow in an observability system: events flow upward through collection nodes (the antler tips) into processors (the base of the antlers) and finally into storage/analysis nodes (the elk’s head).

Under the hood, an ELK stack is a marvel of distributed systems engineering. Elasticsearch (the “E” in ELK) isn’t just a simple database; it’s a clustered search engine built on Apache Lucene that uses inverted indices to make searching billions of log entries feasible in near-real-time. An inverted index is like a book index flipped on its head: instead of chapters pointing to page numbers, you have keywords (or log terms) pointing to the list of documents (log entries) where they appear. This data structure, combined with tokenization and compression, enables lightning-fast full-text search through logs. The elk’s antlers full of Beats hint at the massive volume of data being funneled in — logs from countless sources that must be indexed efficiently. To handle this firehose, Elasticsearch shards the data into pieces distributed across multiple nodes. Those Beats on each tine might each correspond to shards or nodes receiving portions of the data, showcasing the parallel ingestion that Elastic achieves. Underneath that friendly elk exterior, there’s complex machinery: cluster coordination (master nodes electing a leader, handling node joins/leaves), replication (copies of shards on multiple nodes for fault tolerance), and clever merge algorithms that periodically condense scattered log segments for optimal search performance. The meme’s absurd literal elk with logos belies the serious mathematics and engineering ensuring that when your app spews 10,000 log lines per second, you can still query and visualize them without breaking a sweat (or at least, without breaking the cluster).

From a theoretical perspective, the joke even brushes against the concept of observability as defined in control theory: a system is observable if its internal state can be determined by its outputs. In software, those outputs are logs, metrics, and traces — signals of what code is doing. The ELK stack is essentially an implementation of that theory, collecting all those outputs (logs from various app servers, metrics from containers, etc.) and making them searchable and analyzable. Each Beat on the elk’s antlers represents a probe or sensor observing part of a system, emitting data outward. Logstash acts like the central nervous system, aggregating and transforming signals, and Elasticsearch+Kibana provide the memory and vision, respectively, allowing humans to observe the entire system’s state. This is a far cry from the days of logging into each box and running grep on text files. It’s sophisticated: messages might be structured as JSON, timestamps normalized, and fields indexed all automatically.

The inclusion of Beats on every antler tine also alludes to how the ELK stack has grown. Originally it was just ELK (Elasticsearch, Logstash, Kibana), but Beats were added as lightweight shippers to avoid the overhead of running Logstash on every host. Beats are written in Go and optimized to have a tiny footprint, so as not to slow down the application whose logs they’re watching. They use an efficient publish/subscribe protocol (the Elastic Beats protocol, once nicknamed Lumberjack for Logstash’s log transport) to send data to Logstash or directly to Elasticsearch. This protocol includes acknowledgments so Beats won’t drop data; if the network or target is down, Beats can buffer events (even spool to disk) to survive outages. In other words, those antler logos aren’t just for show: they imply a reliable, distributed collection system where each branch knows how to handle back-pressure if the elk’s head (Logstash) can’t keep up. There’s a whole hidden world of queue management, buffering, and retry logic making sure the log stream keeps flowing smoothly.

When Logstash (the L in ELK) receives all these log streams, it’s not just blindly passing them along. It runs each event through a pipeline of transformations. Think of Logstash as the data sorcerer at the center of the elk’s forehead, capable of performing feats like parsing unstructured log lines into structured fields (using the infamous grok regex patterns or JSON decoders), filtering out noise (dropping debug statements or health-check pings), and even enriching events (adding GeoIP info to web access logs, for instance). This processing is powerful but CPU-intensive, which is why you often scale Logstash horizontally or assign more antlers (i.e., instances) for heavy workloads. In the meme, the Logstash logo sits right before the Elasticsearch logo, showing that it’s the last stop before data is ingested into storage. Technically, one could send Beats directly to Elasticsearch, but then you’d lose that rich transformation and buffering stage Logstash provides. Real pipelines often introduce message queues (like Kafka) between Beats and Logstash for resilience – a detail not shown in the meme’s simplified “elk anatomy” but very much part of complex, real-world observability setups.

Finally, the Kibana logo on the elk’s nose completes the picture, literally at the animal’s nose-tip. This placement is a clever visual pun: Kibana is how we see the data (as if the elk uses Kibana on its nose like glasses or binoculars to look at the logs). Kibana (the “K” in ELK) is the user-facing part of the stack – it provides dashboards, query interfaces, and visualizations. When something’s going wrong in production and logs are stampeding in, Kibana lets DevOps engineers sniff out the issue by searching those logs, filtering by fields, and graphing trends over time. It’s essentially the GUI that sits on top of Elasticsearch, issuing queries and displaying results in human-friendly ways (tables, charts, maps, you name it). The meme putting Kibana front and center (or front and nose) highlights that for many users, Kibana is the face of the ELK stack – it’s what people interact with when they say “let’s check the logs.”

So, this one image manages to encode a full observability pipeline: dozens of log producers (Beats) feeding into a log processor (Logstash), indexing into a scalable search engine (Elasticsearch), with a visualization layer on top (Kibana). The humor is that such a sophisticated, multi-stage data flow is whimsically condensed into an elk with some logos stuck on its antlers, as if this wild animal magically does all our log wrangling. Yet anyone who’s maintained a real ELK cluster knows there’s nothing magic about it – it’s careful engineering. The elk’s many tines also evoke the gnarly complexity that can arise: one misconfigured Beat and you drop data, one poorly written regex in Logstash and the pipeline backs up, one out-of-memory error in Elasticsearch and the whole herd (cluster) panics. Distributed systems theory lurks in the background: for example, how Elasticsearch, being distributed, sacrifices some immediate consistency for availability – newly indexed log events might take a second or two to become searchable (an eventual consistency trade-off acceptable for logs). CAP theorem haunts every corner of these systems; if network partitions happen, should the stack drop incoming logs or accept them at risk of some replication delay? Usually, the ELK stack chooses to keep accepting data (Availability) and catch up on consistency later, because in observability, losing logs (data) is considered worse than having slightly stale search results for a moment. All these nuanced technical decisions are hiding behind the meme’s casual text “ELK stack or something idk I’m not devops”. The contrast is hilarious to those in the know: we’re looking at a dense forest of technology (pun intended) presented as if it were just a quirky coincidence of an animal pun.

Description

A high-resolution wildlife photo shows a large elk standing in a blurred, autumn-colored forest clearing. Each tine of the elk’s branching antlers has the Elastic Beats logo (white rectangle with stylized blue 'B' and the word “beats”) pasted onto it, forming a visual pipeline that culminates near the animal’s forehead where Logstash and Elasticsearch logos appear. Centered over the elk’s nose is the Kibana logo. Bold white caption text across the animal’s chest reads: “ELK stack or something idk I’m not devops.” The meme plays on the homonym between “elk” the animal and “ELK” (Elasticsearch, Logstash, Kibana) plus Beats, poking fun at how non-SRE team members casually wave off observability tooling with a shrug while production logs stampede

Comments

6
Anonymous ★ Top Pick Sure, just stick another Beat on the rack - because nothing says “single pane of glass” like an actual ungulate with 14 separate data shippers
  1. Anonymous ★ Top Pick

    Sure, just stick another Beat on the rack - because nothing says “single pane of glass” like an actual ungulate with 14 separate data shippers

  2. Anonymous

    When you've spent three sprints building custom logging infrastructure only to discover your team reinvented the ELK stack poorly, but at least now you understand why the DevOps team drinks so much

  3. Anonymous

    The ELK stack: where your logs go to get antler-yzed. Sure, you've got Beats shipping metrics from every microservice, Logstash parsing JSON like it's going out of style, and Kibana dashboards that look impressive in meetings - but can you explain why your retention policy is eating 40% of your AWS bill? The real observability challenge isn't instrumenting your code; it's explaining to your CTO why you need a dedicated Elasticsearch cluster that costs more than your entire backend infrastructure, just so you can grep through logs with a fancy UI

  4. Anonymous

    Anyone can slap Beats everywhere, but without sane ILM, grok discipline, and index templates, you’ve just built a very expensive wildlife preserve for runaway shards

  5. Anonymous

    Non-DevOps explaining ELK: majestic antler diagram, zero Beats shipping to prod

  6. Anonymous

    Classic ELK topology: Beats multiply like antlers, Logstash duct-tapes it together, Elasticsearch chokes on cardinality, and the developer pleads 'not DevOps' during the 3am shard reallocation

Use J and K for navigation