The Zen of a Perfectly Stable Production Environment
Why is this Observability Monitoring meme funny?
Level 1: The Little Tree That Could
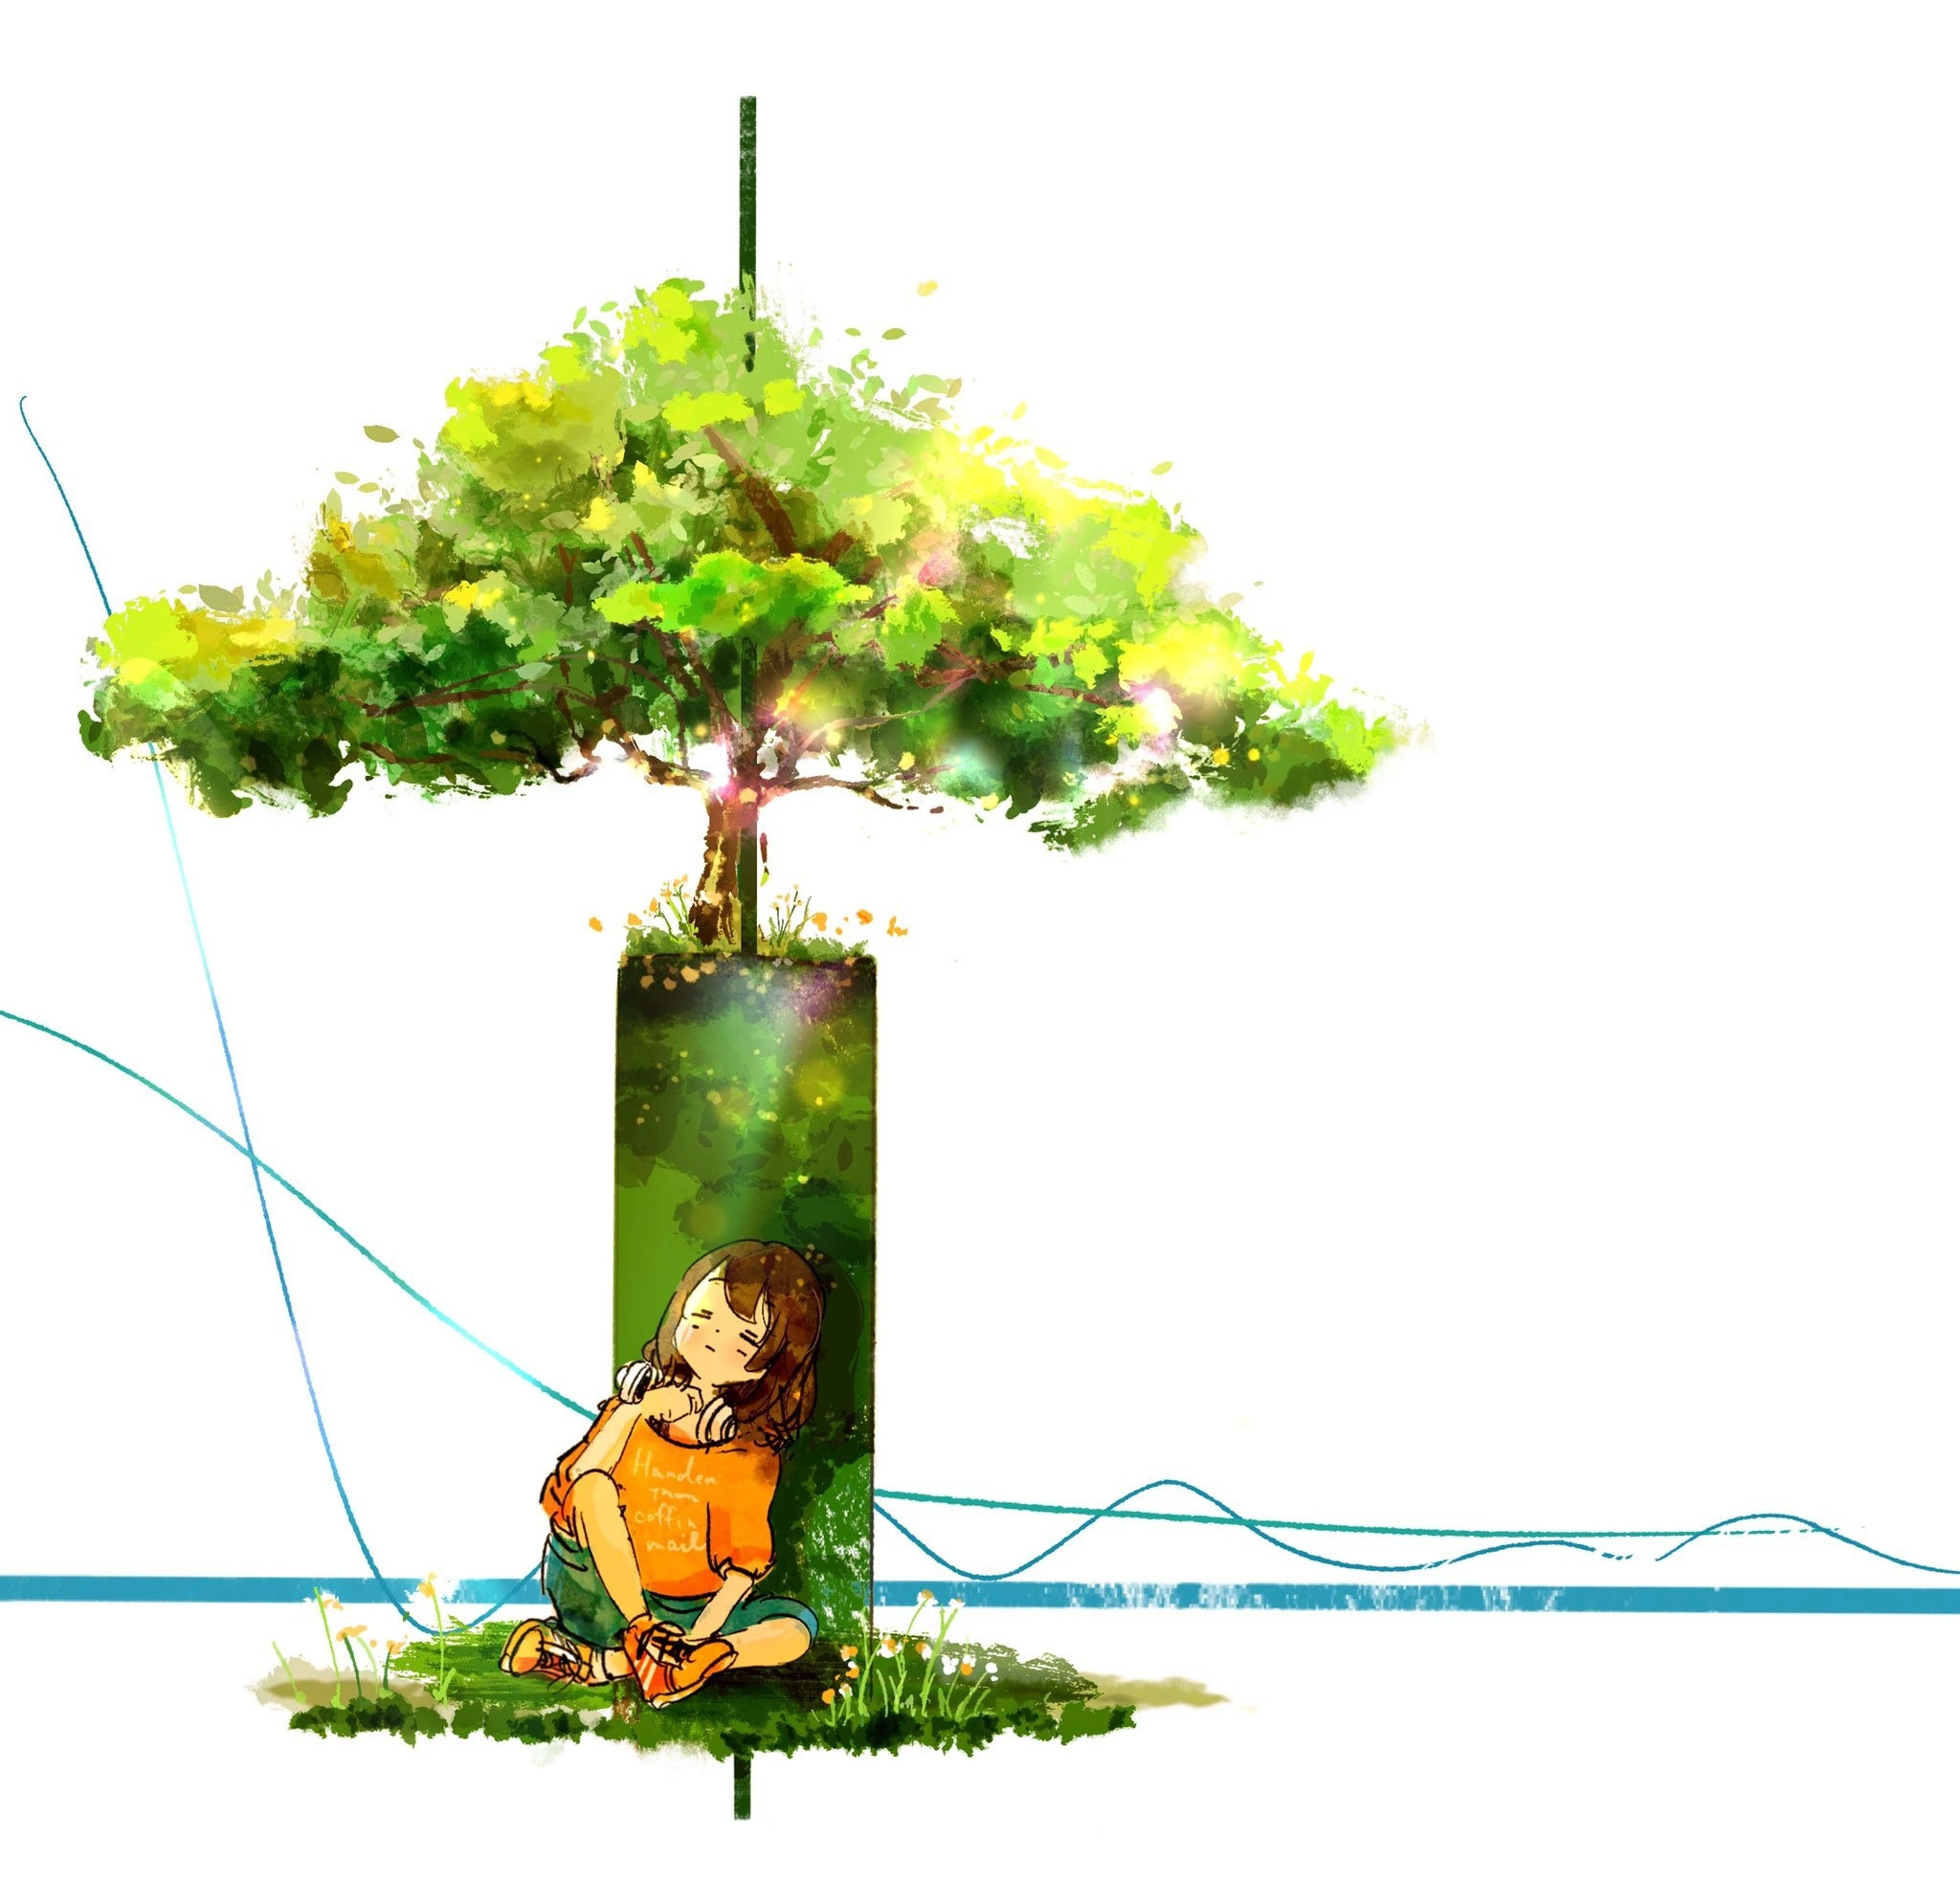
Imagine you have a big task that usually a whole team would do, but instead one friend is doing everything all by themselves, quietly. Think of a school project where five kids are in a group, but only one kid does all the research, writes the report, and even makes the poster, while the others just watch. The project turns out great because that one hardworking friend carried it through. It’s kind of funny to see, right? You’re impressed – like, “Wow, they did all that!” – but also a bit worried for them – “Isn’t that a lot to handle alone?” In this picture, that one decision tree is like the one friend doing all the work. It’s a single tree holding up everything, giving shade and support, while the little girl (wearing a "hello world" shirt) leans on it without a care. We find it funny and cute because usually you’d expect a whole forest or a bunch of support beams to share the job, but here just one cheerful tree is doing it all. It’s a happy scene – everything is working out – but we all hope that this strong little tree can keep holding up under the pressure!
Level 2: Growing a Model
Let’s break down what’s going on here in plain terms. In Machine Learning, one of the first models you learn about is the Decision Tree. It’s basically a flowchart that makes decisions by asking a series of questions about the data. Each question is based on a feature (which means an input variable or attribute in your data). For example, imagine we’re trying to decide if someone gets a loan. A decision tree might ask: “Is the person’s income > $50k?” If yes, go to one branch (maybe then ask “Is credit score > 700?”), if no, go to the other branch (perhaps immediately deny the loan). Each branch can lead to more questions (splits) until you reach a final decision at a leaf node. The structure looks like an upside-down tree: a single root question at the top, splitting into branches, and finally leaves that give you answers.
Here’s a tiny pseudocode example of what part of a decision tree’s decision process might look like in a program:
# A simple decision tree logic for loan approval
if income > 50000: # First split: check income
if credit_score > 700: # Second split: check credit score
approve_loan() # Leaf node: decision to approve
else:
deny_loan() # Leaf node: decision to deny
else:
deny_loan() # If income not high enough, deny loan
In a real machine learning scenario, we don’t write these rules by hand – the algorithm learns them from a training dataset. The training data might have lots of examples of people who repaid loans and those who defaulted, along with their income, credit score, etc. The decision tree algorithm finds the splits (like income > 50000) that best separate the cases. It’s essentially learning the most informative questions to ask about the data.
Now, why do we care about multiple trees vs. one tree? Because of something called overfitting. We usually train a model on some data, then we test it on new data (often using a validation set or test set) to make sure it actually learned a general pattern and not just memorized the training examples. When a model performs much better on the training data than on new data, that’s overfitting – it’s like a student who memorized the practice exam answers but can’t handle a slightly different real exam. One way to avoid overfitting is to keep models simpler or use techniques like combining models. A single decision tree can actually become too flexible (especially if it’s allowed to grow very deep with lots of branches). It might end up fitting every noise and detail from the training set. You’d see that as a curve where the training loss/error keeps going down (getting better and better) but the validation loss/error starts going up (getting worse) after a point – meaning the model is no longer improving on new data, only on the data it has already seen. Those blue curves in the background of the image are a typical data visualization of this phenomenon: one curve might represent performance on training data, the other on validation data, across training epochs or tree sizes. The moment they diverge, we suspect the model is overfitting. A common practice is to stop growing the tree further (or to prune it) when we see validation performance degrade.
So what’s funny or notable about “one decision tree carrying the whole production workload”? In real-world applications, it’s more common to use either a simpler linear model or a robust ensemble of models for important tasks, especially if a single decision tree was showing signs of overfitting. Using just one tree in production suggests a few things: maybe the problem was simple enough that one tree was sufficient, or maybe the person deploying it was a bit optimistic (or under time pressure!). There’s an element of prod deployment anxiety here: deploying any model to production can be nerve-racking, but if you know your model might be a little overfit or fragile, you’re going to be crossing your fingers every time new data comes in. The tag hoping_not_to_overfit perfectly captures that feeling of a junior ML engineer who tested their model as much as they could and is now just hoping it performs well on unseen real-world data. The child in the orange "hello world" T-shirt represents that young or beginner developer who has built their first model. “Hello World” is the iconic beginner’s program, so seeing it on the shirt tells us this might be their first big project. They’re leaning on that tree trunk peacefully, maybe a bit naively confident. It’s cute – we’ve all been that newbie who trusts their code a little too much on day one!
The green pillar rising from the grass in the image looks like a single column holding up the tree. In data terms, you can think of that as the one important feature or the narrow basis of the model. It’s as if the entire decision logic (the tree’s branches and leaves) is built on a very slim foundation. In a dataset, having only one strong feature carry your predictions can be risky – what if that feature changes or isn’t available tomorrow? In production, if everything depends on one column of data, that’s a fragile setup. Experienced teams usually add monitoring for the data itself (to catch if that all-important input starts drifting or goes missing). A Random Forest or other ensemble would distribute the importance across many trees and many features, but here we’ve concentrated all the importance in one place.
To a newer developer or someone still learning, the meme is also educational: it emphasizes the concept of a single decision tree model and the potential issues of relying solely on it. It shows a blend of data science (the training/validation curves) and a playful metaphor (a literal tree and a child). The humor comes from the contrast: Machine Learning can get very complex, but in this scenario the entire “AI” is just one tree with if-else rules. It’s like bringing a knife to a high-tech laser fight – and somehow winning. People find that funny and endearing. And it’s a gentle reminder: always test your models on fresh data, and perhaps don’t put all your eggs in one basket (or all your bets on one tree) unless you’re sure it can handle the load!
Level 3: One Tree to Rule All
For seasoned developers and data scientists, this meme hits a very specific nerve. It’s that too real situation where a quick, simple solution becomes the linchpin of an entire system. Picture a production pipeline where, behind all the microservice hype and big-data bravado, there’s literally one silent DecisionTreeClassifier making every critical decision. The caption “one decision tree quietly carries the whole production workload” captures this perfectly. We chuckle because we’ve been there: that one piece of code or one model that was meant as a temporary fix (to be replaced next quarter, promise) but ended up running in production far longer than anyone planned. It’s both hilarious and horrifying to realize an enterprise-grade operation might be teetering on something as simple as a single decision tree!
Why is this funny to an experienced eye? Because it flies in the face of what we preach. We tell juniors about redundancy, scalability, and avoiding single points of failure. Yet here we are with a bus factor of 1 – one model, one pillar holding everything up. It’s like discovering the company’s critical data warehouse is an old PC under someone’s desk. A Decision Tree is a wonderful algorithm to learn with, but relying on just one in prod gives a senior engineer equal parts pride and panic. Pride because, hey, it does mean the solution was elegantly simple – no need for a complex ensemble or deep learning black box if one tree did the trick. Panic because we know how easily that one tree could fall over: all it takes is some weird new input or a slight data distribution change (say hello to data drift) and suddenly that “quiet” workhorse model starts mispredicting like crazy. Production issues incoming!
The visual itself is a goldmine of inside references. The tall green pillar in the illustration looks like a single important feature or a slender data pipeline holding up the model. It’s narrow, implying not much breadth or support – just one main trunk. On top is the lush canopy (the decision tree’s logic spreading out). The child leaning peacefully against the pillar with a "hello world" shirt is clearly the junior ML engineer or developer. That shirt is no accident – “Hello World” is the quintessential first program every coder writes when learning, symbolizing that this person is at the beginning of their coding/ML journey. They appear relaxed, even napping, as if utterly confident that their one-tree model will handle everything. This is where a senior would smirk: the junior doesn’t yet have the scars of midnight pages from an overfitted model gone rogue. The meme humorously contrasts the junior’s calm trust with the senior’s latent anxiety.
And about those blue graph lines in the back: to the uninitiated it’s just some pretty wavy design, but any data scientist recognizes the shape of training vs. validation curves. They snake along the canvas like the plots we see during model training. If you watch closely, many training curves go down (error decreasing) while validation curves eventually turn upward when the model starts overfitting. The fact that they’re crossing behind the scene is a tongue-in-cheek hint: this single tree might have gotten a wee bit too complex for its own good at some point. It’s the validation loss saying, “Careful – you’re memorizing noise now,” but our happy little one-tree model might have ignored that warning. The experienced folks in the room know that feeling: the training accuracy hits 99%, the validation maybe slipped from 95% to 88%, and the newbie says “Ship it, it’s still high!” Meanwhile, the senior engineer quietly schedules a follow-up to discuss regularization or at least implement some monitoring in production.
The humor here also lies in the DataVisualization artistry of the meme. It merges a computer science concept with a nature metaphor. It’s visually saying what we often joke about: our entire project is propped up by one leafy algorithm. It’s both pretty and absurd. In a way, this one decision tree in production is an underdog story. While everyone else in the AI/ML world is bragging about ensembles, deep learning, and stacking models, this little decision tree stands alone, quietly doing its job without fanfare. That juxtaposition is what makes us laugh: we know it’s not “industry best practice,” and yet... if it works, it works! It’s a gentle reminder in the form of DeveloperHumor that sometimes the simplest tech, handled with care (and a bit of luck), can carry massive weight. Just don’t sneeze near that one pillar, okay? 🌳
Level 4: One-Tree Ensemble
At the bleeding edge of Machine Learning theory, seeing a single humble decision tree bearing the load of an entire production system is almost paradoxical. Modern practice loves ensembles – think of a RandomForest with 100+ trees or a deep neural network with millions of parameters – but here we have an ensemble of one. In statistical terms, this is a bold gamble on a high-variance model. A lone Decision Tree (especially a deep one) is a notoriously expressive model: it can carve decision boundaries so finely that it will perfectly fit (and even overfit) whatever data you give it. In fact, an unconstrained decision tree can achieve near-zero training error by memorizing every quirk of the data. The downside? Its VC dimension (a fancy way to say "capacity to fit patterns") is off the charts – it can shatter a dataset into pure memorization. Those undulating blue curves in the background likely represent training vs. validation performance. Notice how one line might keep improving (training error dropping) while the other worsens (validation error rising): that divergence is the signature of overfitting in action. The model is learning noise and random details beyond the true signal.
This touches on the classic bias-variance tradeoff. A single deep tree has extremely low bias (it can fit the training data almost perfectly) but sky-high variance (its performance can swing wildly with slight changes in data). That’s why experienced ML engineers usually prefer an ensemble of trees: methods like bagging (e.g. Random Forests) or boosting combine many decision trees to average out the noise. Multiple trees voting together tend to generalize better than a solo tree, smoothing over each individual tree’s eccentricities. In contrast, here we have one tree doing a tightrope walk without the safety net of its forest friends. It’s as if someone said, “We don’t need a whole forest, this one tree is trusty enough,” defying decades of ensemble wisdom.
Yet, there’s an intriguing counterpoint rooted in Occam’s razor and learning theory: maybe the simplest model that works is actually the best. If the underlying problem is straightforward (perhaps one feature truly dominates the outcome), then a single decision tree might capture the pattern just fine. In that case, adding more trees or layers would only introduce unnecessary complexity and risk overfitting even more. In essence, this one-tree solution could be seen as an Occam’s razor moment in ML – achieving acceptable performance with the minimal model. It’s a reminder that more complex isn’t always more accurate, and sometimes a well-chosen decision stump can outperform a haphazard deep net on the same task.
From a historical perspective, decision trees are one of the older tools in the AI/ML toolbox (CART and C4.5 algorithms have been around since the 1980s). They’ve always been appreciated for their interpretability and simplicity. Seeing one “quietly carry” a modern production workload feels ironically nostalgic: amidst today’s craze for giant neural nets, here’s a nod to a classic algorithm doing the heavy lifting. The meme captures a tiny rebellion against complexity – a single green DecisionTree model standing tall where normally a whole ensemble or a fancy model might be expected. It’s a scenario that makes theoreticians smirk and double-check the validation stats: if it’s working, is it genius or just luck? Either way, it’s a beautiful outlier moment that combines fundamental principles (generalization vs. overfitting) with a dash of AI humor.
Description
An artistic, anime-style illustration with a minimalist aesthetic set against a stark white background. The central focus is a vertical, rectangular slice of a natural scene. Within this slice, a lush green tree with a watercolor texture grows, shimmering with specks of golden light. At the base of the tree, a young person with brown hair, wearing an orange t-shirt, green shorts, and headphones around their neck, sits peacefully with their eyes closed, leaning against the trunk. The text on the shirt is partially visible and appears to say 'Handen... coffin nail'. Thin, wavy blue lines, resembling a performance graph or chart, streak across the foreground and background of the image, intersecting the natural scene. This artwork serves as a metaphor for the state of calm a developer or SRE can achieve. The peaceful character represents an engineer at rest, while the serene tree symbolizes a healthy, stable system. The graph lines floating in the void represent the constant flow of metrics and data from production environments. The overall image captures the rare and cherished moment of tranquility when all systems are green, the monitoring dashboards are quiet, and one can finally disconnect
Comments
7Comment deleted
This is the graphical representation of an SRE's heart rate monitor during a holiday freeze after all critical alerts have been muted. It's not ignorance; it's trust in the system... mostly
We told the VP we’d ship a random forest - turns out the randomness is just everything we forgot to test once this single tree hit prod
Finally achieved work-life balance: I'm now equally burned out by both my job and my meditation app's push notifications
When you finally achieve inner peace with Git's branching model, you realize the tree was inside you all along - along with 47 unmerged feature branches, 3 stale hotfixes, and that one commit from 2019 nobody dares to rebase because 'it might break production.' Namaste, and may your merge conflicts be ever in your favor
Flow state unlocked: perfectly balanced tree, zero merge conflicts, infinite lofi branches
Five years into the rewrite: tracing looks like an EKG, but the monolith still has the lowest p99 - and, apparently, the only shade
Senior dev move: sit under the monolith’s dependency tree, toggle a feature flag to 1%, and watch Grafana’s sine waves confirm we decomposed nothing except our error budget