Developer Productivity as a Daily Trace
Why is this DeveloperProductivity meme funny?
Level 1: The Bumpy Energy Day
This is like drawing a chart of how well someone builds with blocks during the day. They do better after a drink and some quiet time, worse when people keep interrupting, and much worse when their instruction book disappears. The funny part is that programmers are treated like machines, but the chart shows they run on sleep, snacks, help, and mood like everyone else.
Level 2: Context Switches Hurt
Developer productivity is not just typing speed. It includes understanding the problem, remembering how the system fits together, testing changes, reading errors, and making decisions without breaking something else.
Context switching means moving your attention from one task to another. In the chart, mail, standup, lunch, and interruptions all pull the developer out of coding mode. The cost is not only the time spent on the interruption. The bigger cost is rebuilding the mental picture afterward.
Stack Overflow dependence refers to how often programmers rely on community answers, examples, and explanations to solve practical problems. That is not automatically bad; programming is too broad for one person to memorize everything. The joke is that when this support disappears, the graph shows productivity falling as if a critical service went offline.
For a newer developer, this chart explains why some days feel weirdly unproductive even when you were busy all day. You may have attended meetings, replied to email, helped someone, read docs, got stuck, searched for answers, and still feel like you "didn't code." The work happened, but the graph was noisy.
Level 3: Human Cron Failure
The chart is titled:
DEVELOPER PRODUCTIVITY
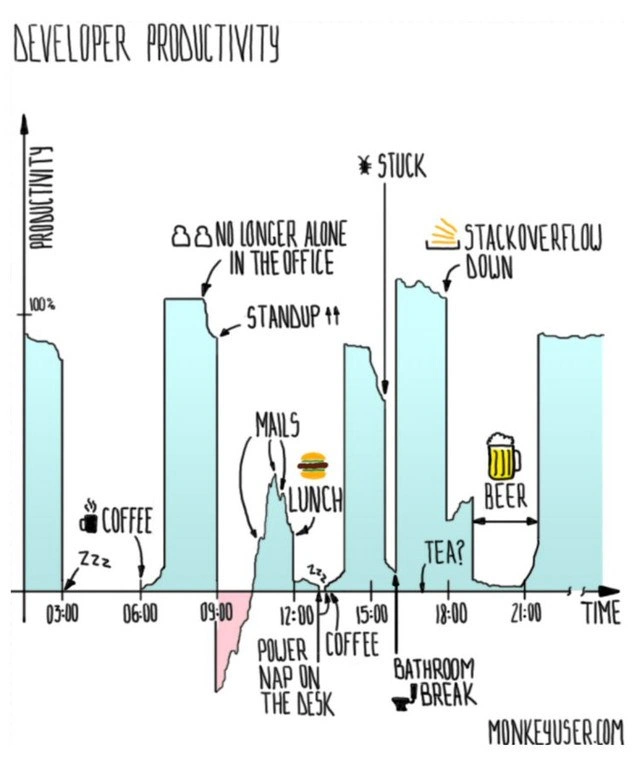
and it plots PRODUCTIVITY against TIME as if a developer's day were a clean observability graph. That is the technical joke: the workday is presented like a measurable system, but every spike and crash is caused by painfully human dependencies. The line drops near:
Zzz
recovers at:
COFFEE
then gets distorted by:
STANDUP ++
and later collapses around:
STACKOVERFLOW DOWN
This is funny because it treats developer output as a fragile runtime environment. Sleep, caffeine, office noise, standup meetings, email, lunch, naps, bathroom breaks, being stuck, external knowledge sources, and after-work drinks all become performance variables. The graph looks like a distributed trace, except the slow spans are "mails" and "forgot how arrays work until search came back."
Experienced developers recognize the anti-pattern underneath: companies often talk about productivity as if it were a linear eight-hour block. The chart says no. Programming depends on deep work, and deep work is brittle. A thirty-minute interruption does not always cost thirty minutes; it can destroy the mental model needed to hold a bug, API contract, database schema, and half-written solution in your head at the same time. The "STANDUP ++" annotation is especially sharp because standups are supposed to unblock work, but the graph shows them as another event that changes the shape of the day.
The "STACKOVERFLOW DOWN" moment is the dependency joke. Developers like to pretend they are independent problem-solving engines, but the modern workflow often includes search results, documentation, issue threads, examples, and other people's mysteriously accepted answers from twelve years ago. When that source disappears, productivity takes a very dignified dive off a cliff.
The post caption, "Ruin your health with fun and respect from industry pros," adds the darker layer. The chart normalizes an unhealthy rhythm: sleep deprivation, desk naps, stimulant recovery, late-day salvage work, and beer as the final state transition. It is a joke, but it points at a real cultural bargain in software: burn yourself out attractively enough and people may call it passion.
Description
A hand-drawn chart titled "DEVELOPER PRODUCTIVITY" plots "PRODUCTIVITY" on the vertical axis against "TIME" on the horizontal axis, with a pale blue filled line rising and crashing through the day. Visible annotations include "Zzz," "COFFEE," "NO LONGER ALONE IN THE OFFICE," "STANDUP ++," "MAILS," "LUNCH," "POWER NAP ON THE DESK," another "COFFEE," "STUCK," "BATHROOM BREAK," "STACKOVERFLOW DOWN," "TEA?," and "BEER," with time marks around 03:00, 06:00, 09:00, 12:00, 15:00, 18:00, and 21:00. The bottom right credits "MONKEYUSER.COM." The technical joke is that developer output is shown as a fragile function of sleep, caffeine, standups, email, Stack Overflow availability, and interruptions rather than a simple eight-hour work block.
Comments
7Comment deleted
It is a distributed trace of a workday, except every slow span is either standup, caffeine, or Stack Overflow returning 503.
Sadly it's not only developer's issue. Comment deleted
So... I just need to sleep 24 hours per day and i will get 100% productivity?!?! Thanks! Comment deleted
no, you understood the graph incorrectly. You start sleeping at 3:00 Comment deleted
ohh okey, thanks for ruining it😒 Comment deleted
np, I'm very good at that Comment deleted
wtf is that lol Comment deleted