Skip to content
DevMeme
7443 of 7506
Codex Logs Benchmark SSD Mortality at 640 TB

Codex Logs Benchmark SSD Mortality at 640 TB

Why is this Tooling meme funny?

Level 1: The Endless Diary

Imagine a helper who writes down everything it does in a diary, including “moved pencil,” “looked at page,” and “still looking at page.” It keeps erasing old notes so the diary never gets very thick, but the constant writing and erasing wears out the pencil and paper. The joke is that a tool meant to help with code may spend so much effort describing itself that it hurts the computer underneath it.

Level 2: Three SQLite Sidecars

An SSD stores data on flash chips. Writing to it causes gradual physical wear, so manufacturers publish an endurance value called TBW. A rating of 600 TBW means the warranty covers a stated amount of cumulative writes, subject to its other terms. It does not mean the drive holds 600 TB, and it does not mean reading data causes the same wear.

SQLite is a database engine that stores a database in an ordinary local file. It is popular in desktop tools because it needs no separate database server. The files visible in the screenshot have separate jobs:

File Basic role
logs_2.sqlite Main database containing durable tables and indexes
logs_2.sqlite-wal Recently committed page changes waiting to be checkpointed
logs_2.sqlite-shm Shared coordination/index data for WAL access

A log is a record of something the software did, such as receiving an event or encountering an error. Logging helps developers diagnose bugs, but levels matter. ERROR and WARN usually describe noteworthy failures or risks; DEBUG and TRACE can describe extremely fine-grained internal activity. Leaving the noisiest level on during normal use is like hiring a court reporter to transcribe every keystroke, fan spin, and moment of indecision.

The screenshot's math means the reporter saw the computer's total-write counter rise much faster than expected, then traced much of that traffic to the Codex log database. The visible database may remain only a few gigabytes because old entries are deleted or pages are reused. SSD wear depends on cumulative writes, not merely the final file size—just as repeatedly erasing and rewriting one notebook page still wears the paper even if the notebook never becomes thicker.

For users, the safe high-level response to a suspected tooling bug is to verify the affected version, update when a fix is available, observe disk-write metrics, and preserve backups. Randomly deleting a live database or its WAL file can corrupt data because the files form one coordinated state. The durable fix belongs in the application: stop producing or persisting unnecessary events before they reach storage.

Level 3: The Log Eats Disk

The comedy comes from a diagnostic subsystem becoming the dominant workload of a coding tool. Logs are supposed to explain what the product did. Here, the screenshot suggests that the act of preserving explanations may consume more hardware lifetime than the user's actual projects. The accompanying post message, And broken ssd 🌚, reduces a layered storage failure to the world's least attractive bundled feature.

The three filenames make the report feel painfully credible:

~/.codex/logs_2.sqlite
~/.codex/logs_2.sqlite-wal
~/.codex/logs_2.sqlite-shm

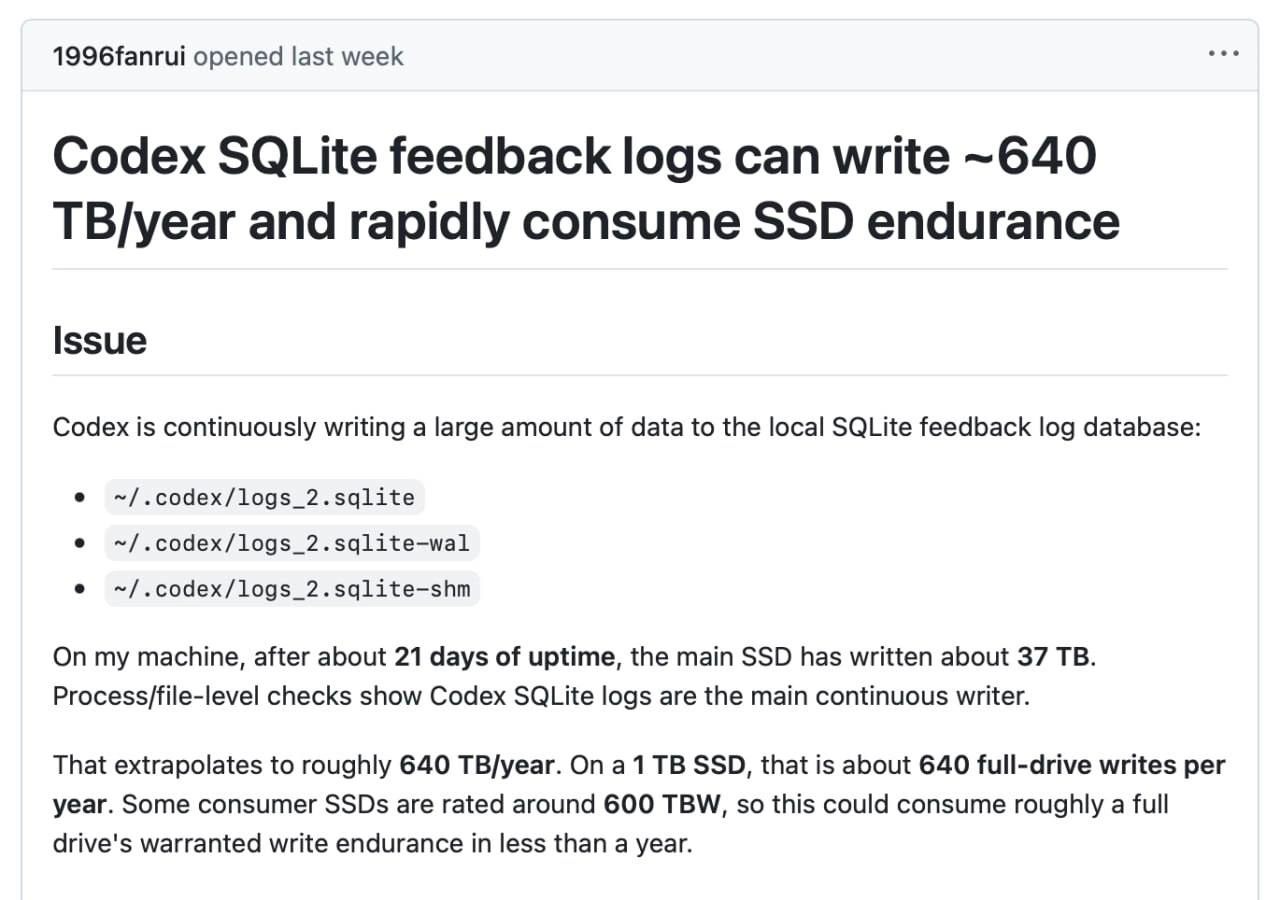
They identify a local SQLite database and its WAL-related sidecars, not three independent copies of every log. The screenshot reports about 37 TB written after roughly 21 days of uptime and says file-level checks found these logs to be the main continuous writer. It then compares the annualized rate with the endurance rating of a consumer SSD. The absurdity is scale: a feedback log—a secondary internal feature—has allegedly acquired the write profile of serious storage infrastructure.

The likely anti-pattern is overly verbose persistent logging on a hot path. Trace-level events can be valuable during a short investigation, but streaming model responses, network activity, filesystem notifications, and telemetry can produce events many times per second. Persisting all of them by default converts ephemeral diagnostic chatter into durable database traffic. If multiple processes share the sink, duplicate or mirrored events make the problem worse. The AI may be generating code in the foreground while its observability layer writes a director's commentary for every byte in the background.

Retention alone does not solve this. Consider a table capped at 30,000 rows:

INSERT INTO logs (...) VALUES (...);
DELETE FROM logs WHERE id IN (...old rows...);

The row count can remain flat while the drive processes an unbounded stream of inserts, index changes, deletions, WAL frames, and checkpoints. Rotating files or deleting old records protects disk capacity; filtering events before persistence protects write volume. Those are different operational goals, and the meme exists because someone apparently optimized the first while the second quietly bench-pressed the SSD.

Good logging design applies controls as early as possible:

  • Set production defaults to useful levels such as warnings and selected informational events.
  • Sample repetitive events rather than recording every occurrence.
  • Deduplicate mirrored telemetry and avoid persisting full streaming payloads unnecessarily.
  • Batch transactions so many records share database and synchronization overhead.
  • Bound both retained size and write rate, then expose metrics for each.
  • Test sustained I/O under realistic long-running workloads, not only database file size.

The systemic lesson reaches beyond Codex. Developer tools run for hours, inspect sensitive repositories, watch files, stream network data, and often update themselves. Their local agents deserve the same performance budgets and observability discipline as server software. “It's only a log” is how a low-priority feature becomes a high-priority incident while remaining invisible in the user interface.

The screenshot should still be read as a bug report, not a universal prediction. It shows one reporter's machine, one observation window, and an extrapolation. It does not show drive model, exact active-use time, Codex version, background workload, SMART counter definition, or independent reproduction. The responsible conclusion is that the reported rate warrants investigation and remediation—not that every Codex installation writes exactly 640 TB each year or that every affected SSD is already doomed. A memorable headline opens an issue; careful measurement closes one.

Level 4: Where Writes Become Wear

The issue title visible in the screenshot is unusually literal hardware humor:

Codex SQLite feedback logs can write ~640 TB/year and rapidly consume SSD endurance

That claim sits at the boundary between an application-level logging bug, SQLite's write-ahead log, the operating system's block layer, and the SSD controller's flash-translation machinery. The surprising part is that none of those layers has to store 640 TB at once. The danger comes from repeatedly rewriting a much smaller working set until the cumulative traffic becomes enormous.

NAND flash cannot generally overwrite arbitrary bytes in place. It programs data in pages but erases larger blocks, and each block tolerates a finite number of program/erase cycles. An SSD therefore maintains a flash translation layer that maps logical addresses from the operating system to physical flash pages. When a logical block changes, the controller usually writes a fresh physical page, marks the old page stale, and later consolidates live pages so an entire block can be erased. Wear leveling spreads this work across the device; spare capacity gives the controller room to maneuver.

This creates several distinct quantities that are easy to collapse into one frightening number:

  • Application bytes are the payload Codex intends to record.
  • Host writes are blocks the operating system sends to the SSD.
  • NAND writes are what the controller ultimately programs internally.
  • TBW, or terabytes written, is a manufacturer's endurance-warranty measure, usually based on cumulative host writes under specified conditions.

Filesystem behavior, database page updates, and SSD garbage collection can make host or NAND traffic exceed the useful log payload. That ratio is write amplification. The screenshot's “37 TB” is therefore meaningful only with its measurement source understood: it is not automatically 37 TB of retained logs or 37 TB of physical flash damage. The report says process/file-level checks identified these SQLite files as the main continuous writer, which is strong diagnostic evidence, but the image does not show a controlled hardware benchmark.

SQLite's WAL mode explains why ~/.codex/logs_2.sqlite-wal appears beside the main database. Instead of modifying database pages immediately, a writer appends new versions of changed pages to the WAL. Readers can continue using the main database plus the committed WAL state. A checkpoint later copies the latest pages back into the main database so old WAL frames can be reused or discarded. The -shm file supports a shared-memory index that helps processes locate WAL pages efficiently.

WAL mode is not inherently an SSD shredder; it is often faster and more concurrency-friendly than rollback journaling. The pathological pattern is a hot producer emitting huge numbers of low-value events while retention logic continually inserts and prunes rows. Every small logical record can touch table pages, index pages, WAL frames, and later checkpoint writes. If the retained database stays modest while identifiers reveal billions of historical inserts, deletion is functioning as a space policy but failing as an I/O policy. The disk still remembers every disposable thought long enough to regret it.

The image's extrapolation is arithmetically sound as a rough projection:

$$ 37\ \text{TB} \times \frac{365\ \text{days}}{21\ \text{days}} \approx 643\ \text{TB/year} $$

For a nominal 1 TB drive, that is roughly 640 drive writes per year. Comparing it with a 600 TBW rating illustrates why the report is alarming. But TBW is not a timer that makes a drive instantly die at 600.000 TB; it is a warranty threshold, and actual endurance varies with workload, temperature, controller behavior, flash type, over-provisioning, and manufacturing variation. Likewise, projecting 21 days across a full year assumes the same activity and write rate continue. “Could” in the title is doing important engineering work.

Description

A cropped GitHub issue on a white page shows the header "1996fanrui opened last week" and the bold title "Codex SQLite feedback logs can write ~640 TB/year and rapidly consume SSD endurance." Beneath an "Issue" heading, the report says Codex continuously writes large amounts of data to its local SQLite feedback-log database and lists `~/.codex/logs_2.sqlite`, `~/.codex/logs_2.sqlite-wal`, and `~/.codex/logs_2.sqlite-shm`. The remaining text says that after about 21 days of uptime the machine's main SSD had received about 37 TB of writes, with process/file-level checks identifying the Codex SQLite logs as the main continuous writer. It extrapolates that rate to roughly 640 TB per year—about 640 full-drive writes on a 1 TB SSD—and warns that a consumer drive rated near 600 TBW could exhaust its warranted endurance in under a year, making excessive diagnostic logging and SQLite WAL churn the darkly comic failure mode.


Comments

1
Anonymous ★ Top Pick The model is stateless; apparently the NAND is taking notes.
  1. Anonymous ★ Top Pick

    The model is stateless; apparently the NAND is taking notes.

Use J and K for navigation