Anthropic Status Page: Major Outage Across claude.ai, API, and Claude Code
Why is this AI ML meme funny?
Level 1: When the Power Company Blinks
Imagine a whole town that cooks every meal with electric stoves — nobody keeps matches or a camp stove anymore. The picture is basically the power company's report card showing the lights have been flickering more and more each week, with three big red "OUT OF ORDER" stamps on it today. The joke, and the worry underneath it, is the same thing: everyone stares at the report card asking "when will it come back?" instead of asking the scarier question — what do we do if it doesn't?
Level 2: How to Read a Status Page
The key concepts on display:
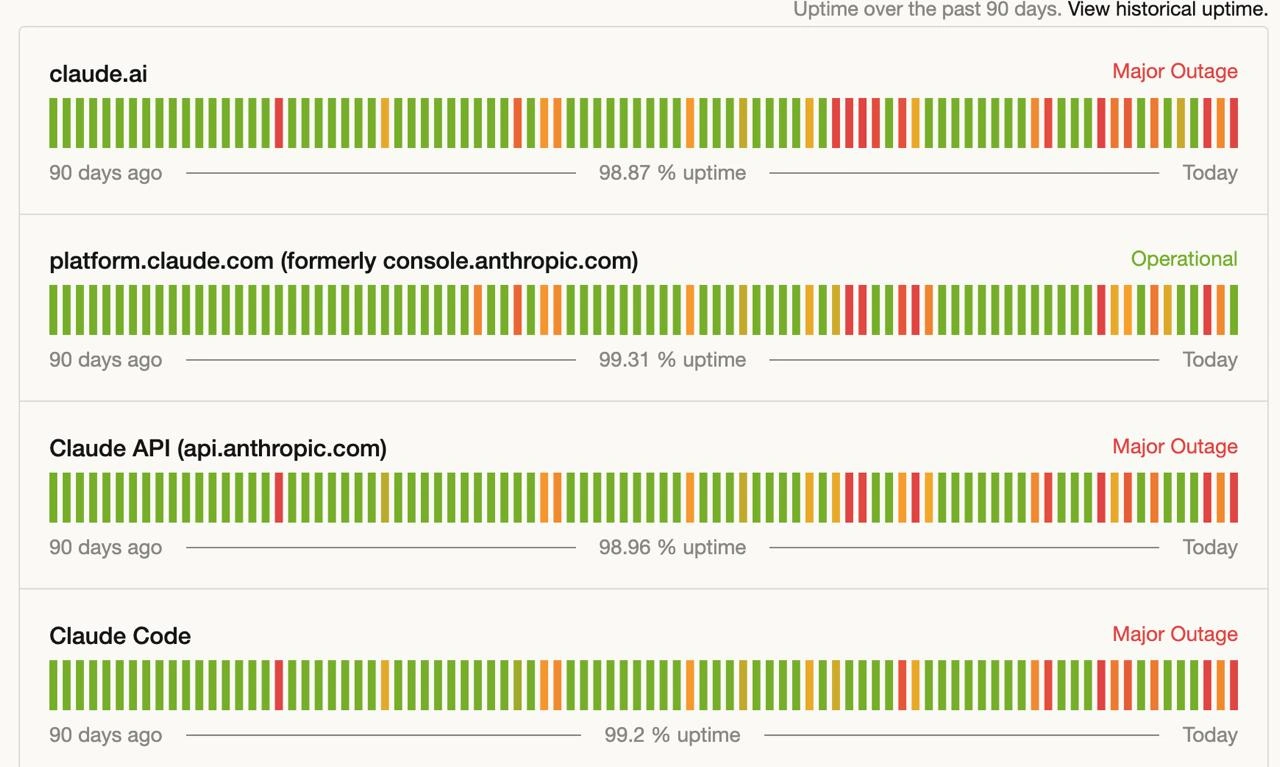
- Status page: a public dashboard (often hosted on a service like Statuspage) where companies report the health of each component. Each vertical bar is one day; green = operational, orange = degraded performance, red = outage.
- Uptime percentage: the share of time a service was available over a window — here, 90 days. It sounds high until you do the math: 99% uptime still allows ~21.6 hours of downtime in 90 days.
- SLA (Service Level Agreement): a contractual promise of availability, usually expressed in "nines" — 99.9%, 99.99%, etc. Each extra nine is exponentially harder and more expensive to achieve.
- Supply chain risk: traditionally, the danger that something you depend on (a library, a build tool, a vendor) fails or is compromised, breaking your product. The caption applies this to AI coding tools: if your team's workflow depends on Claude Code, an outage there is effectively an outage of your team.
Your first encounter with this is usually visceral: you're mid-task, the assistant stops responding, you assume it's your network, your VPN, your config — and only after fifteen minutes of self-doubt do you check the status page and see red. Lesson one of incident response: check upstream before blaming yourself.
Level 3: The Nines You Don't Have
This isn't a meme in the traditional sense — it's a raw screenshot of the Anthropic status page, and that's exactly why it lands harder than any image macro could. Three of four components — claude.ai, Claude API (api.anthropic.com), and Claude Code — are flagged Major Outage in red, while platform.claude.com smugly reports Operational, which is the observability equivalent of the billing portal staying up while the product is down. The poster's caption cuts to the actual point:
"No, but for real — what's wrong with this supply chain risk"
Read the bars, not the labels. Across all four 90-day charts, the left side is a wall of green; the right third gets progressively striped with orange and red. That's not random noise — that's the classic reliability signature of a service being scaled under fire: usage exploding faster than capacity planning, incident frequency climbing as load grows. Every SRE has seen this chart shape before; usually it's their chart, presented in a postmortem with the phrase "elevated error rates."
The numbers are the quiet brutality. 98.87%, 98.96%, 99.2% — none of these clear even three nines (99.9%), the floor most enterprise SLAs treat as table stakes. Two nines means roughly seven hours of downtime per month. For a CDN, annoying. For a tool that has become the de facto pair programmer for a large slice of the industry, it's a single point of failure with no failover — and that's the supply-chain framing in the caption. We spent a decade hardening pipelines against malicious npm packages and compromised dependencies, then casually rewired the production of software itself through one vendor's API. When api.anthropic.com goes red, it isn't one app degrading; it's thousands of engineering orgs simultaneously discovering their velocity had a hidden upstream dependency with no package-lock.json and no vendored fallback. The status page becomes the industry's shared heartbeat monitor — and everyone refreshing it mid-outage is implicitly admitting they can't, or won't, work without it.
Description
A screenshot of the Anthropic status page showing 'Uptime over the past 90 days' with four components and their daily uptime bar charts (green for operational, orange for degraded, red for outage days). claude.ai shows 'Major Outage' at 98.87% uptime; platform.claude.com (formerly console.anthropic.com) shows 'Operational' at 99.31%; Claude API (api.anthropic.com) shows 'Major Outage' at 98.96%; Claude Code shows 'Major Outage' at 99.2%. The right side of each bar chart is visibly denser with red and orange stripes, implying reliability degrading as usage explodes - a relatable scene for every developer whose AI pair programmer suddenly disappears mid-task
Comments
2Comment deleted
98.9% uptime is fine until you realize the missing 1.1% is precisely the afternoon your entire engineering org forgot how to code without it
weak Comment deleted