
The Project Management Curve: Ship It by Lowering the Bar
Description
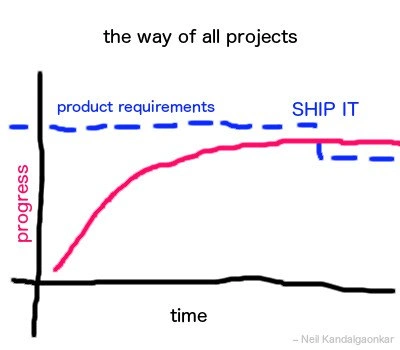
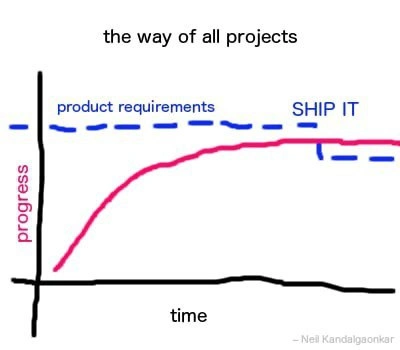
A hand-drawn style graph titled 'the way of all projects' that humorously illustrates a common software development lifecycle reality. The chart plots 'progress' (y-axis) against 'time' (x-axis). A dashed blue line representing 'product requirements' remains high and mostly constant. A solid pink line, representing actual progress, starts low, climbs steadily, and then plateaus, getting agonizingly close to the requirements line but never reaching it. The punchline occurs when, instead of progress meeting the requirements, the 'product requirements' line suddenly drops to meet the level of the progress line. At this intersection, the text 'SHIP IT' appears. The chart, credited to Neil Kandalgaonkar, is a cynical but accurate commentary on how projects are often completed: not by finishing all planned work, but by redefining 'done' and cutting scope to meet deadlines. It's a universal experience for senior developers who have seen initial grand visions compromised for a pragmatic release

Comments
9Comment deleted
This isn't scope creep; it's scope drop. The feature isn't 'missing'; it's just been moved to the 'post-MVP nirvana' epic that we'll totally get to after the heat death of the universe
We’ve officially adopted Asymptote-Driven Development: once velocity plateaus, just slide the spec under the curve and announce GA
After 20 years in tech, I've learned that the only constant is the asymptotic relationship between actual progress and requirements - they approach each other infinitely but only touch in the parallel universe where estimates are accurate and stakeholders don't change their minds mid-sprint
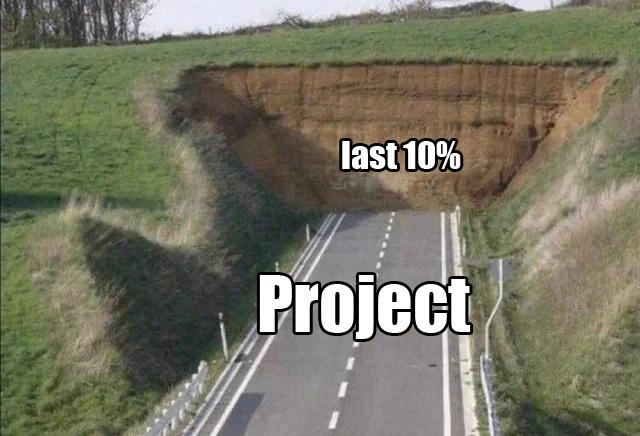
Ah yes, the classic sigmoid curve of despair - where requirements drift upward like cloud costs, actual progress asymptotically approaches 'good enough,' and that black flatline represents the documentation we swore we'd write. The 'SHIP IT' marker arrives precisely when management's patience expires, not when the code is ready. We've all lived this graph: the first 90% takes 90% of the time, and the last 10% takes the other 90%. The real engineering challenge isn't building the system - it's explaining to stakeholders why their ever-expanding requirements can't magically compress into a fixed timeline while maintaining our sanity and the laws of physics
The intersection of logistic progress and a quarter-end acceptance-threshold decay is GA - “Generally Announced,” not “Generally Available.”
When progress asymptotes, the only stable control loop is changing the setpoint - rename requirements to MVP, hit SHIP IT, and declare convergence
Hofstadter's Law visualized: projects always take longer than expected, even when accounting for Hofstadter's Law - until that final 'SHIP IT' quantum leap
Hahahahahahahah true Comment deleted
Most projects Comment deleted