
Embracing the Post-Deployment Chaos
Description
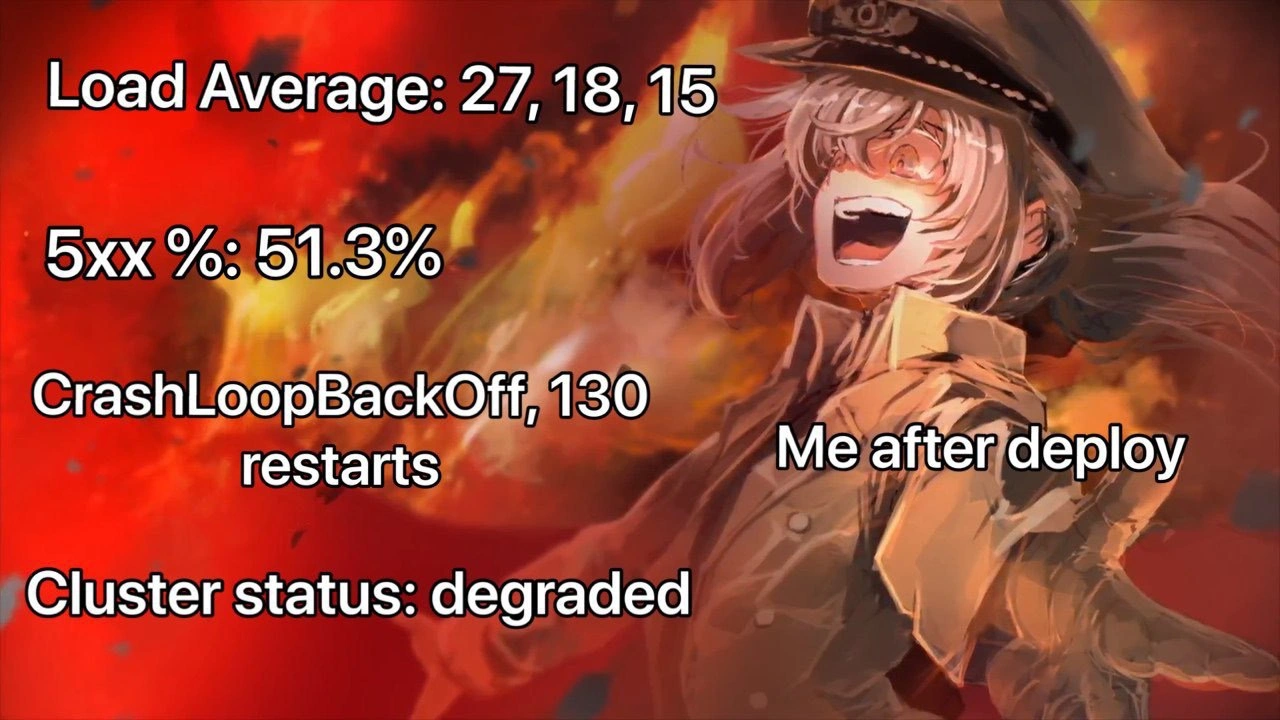
The meme features Tanya von Degurechaff from the anime 'The Saga of Tanya the Evil', laughing maniacally with a wide, joyous expression against a backdrop of intense orange and red flames. Overlaid on this chaotic scene are several lines of white text, indicating critical system failure metrics. From top to bottom, the text reads: 'Load Average: 27, 18, 15', '5xx %: 51.3%', 'CrashLoopBackOff, 130 restarts', and 'Cluster status: degraded'. Another text overlay near the character says 'Me after deploy'. This meme captures the dark humor of a catastrophic deployment. The metrics are all indicators of a system under extreme stress: a very high load average signifies overwhelmed CPUs, a 51.3% 5xx error rate means over half of server requests are failing, 'CrashLoopBackOff' is a well-known Kubernetes state for a repeatedly crashing application, and a degraded cluster status confirms the system is unhealthy. The humor lies in the engineer's seemingly joyful, unhinged reaction to the production disaster they've just caused, a feeling of detached amusement that can sometimes follow a massive failure



Comments
7Comment deleted
That's not a degraded cluster, that's a successful chaos engineering experiment. The report will show the system's high availability for displaying 503s
Sure, the load average is 27, but look on the bright side - our error budget is finally getting some exercise
The beautiful thing about CrashLoopBackOff is that it gives you 130 chances to watch your init container fail in slightly different ways while you slowly realize the ConfigMap you deployed is pointing to the wrong AWS region
Ah yes, the classic post-deployment experience: watching your load average climb into the stratosphere while your pods enter an infinite CrashLoopBackOff death spiral, achieving that coveted 51.3% error rate that really shows you've mastered the art of distributed systems failure. At this point, you're not debugging - you're conducting a post-mortem on a system that's still technically alive. The real question isn't 'what went wrong?' but rather 'which of the 47 microservices we deployed simultaneously decided to take down the entire cluster?' Pro tip: when your monitoring dashboard looks like this, it's not a deployment - it's a cry for help wrapped in YAML
Deployed the 'hotfix' - now CrashLoopBackOff is our cluster's favorite dance, looping 130 times to the tune of 27 load avg
The canary died, the HPA started crossfit, and by T+2 minutes our SLO was a memory - CrashLoopBackOff is the only thing consistently up
Nothing says “mature release process” like burning the quarter’s error budget in 30 seconds while the HPA thrashes pods into CrashLoopBackOff and rollback races PagerDuty’s ringtone