
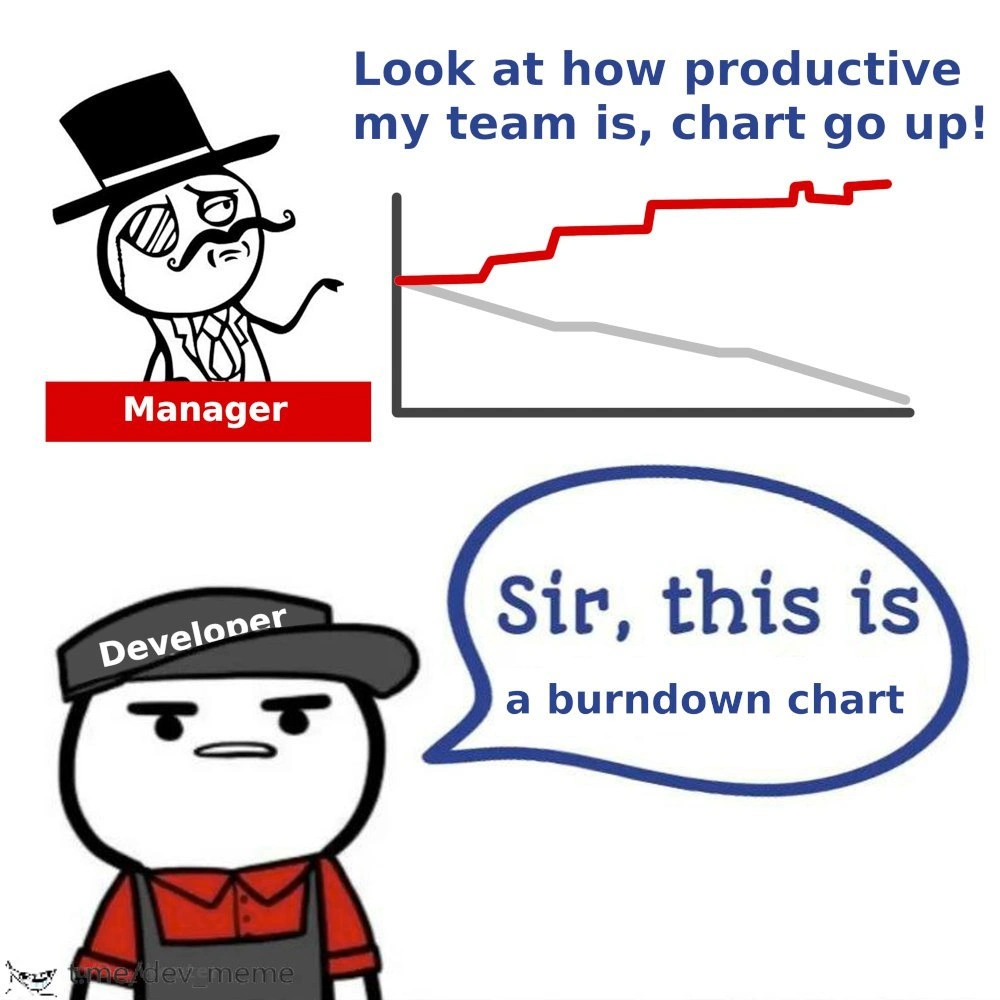
When the Only Metric is 'Chart Go Up'
Description
A two-part meme contrasting a clueless manager with a deadpan developer. In the top half, a cartoon figure in a top hat and monocle, labeled 'Manager', gestures proudly towards a line graph. The manager exclaims, 'Look at how productive my team is, chart go up!'. The chart itself displays a grey line trending downwards and a red line trending sharply upwards. In the bottom half, a cartoon developer in a baseball cap and overalls, labeled 'Developer', looks unimpressed and says in a speech bubble, 'Sir, this is a burndown chart'. The humor is rooted in the manager's complete misinterpretation of a fundamental agile metric. A burndown chart tracks remaining work, so an upward-trending line signifies a project in deep trouble, likely due to scope creep or stalled progress. The manager's celebration of this negative trend highlights a common frustration among developers: leadership that is metric-obsessed but data-illiterate


Comments
9Comment deleted
A manager seeing a rising burndown chart and calling it 'productivity' is the corporate equivalent of seeing a memory leak and calling it 'dynamic cache allocation'
Our burndown chart is basically Kafka - append-only, eventually consistent, and management keeps reading it like a success log
After 20 years in tech, you realize the only thing that reliably goes up and to the right is the burndown chart when product keeps adding 'just one more small feature' mid-sprint while the CEO promises investors you're 'ahead of schedule'
When your manager celebrates the burndown chart going up, you know you're not burning down work - you're burning out developers. It's the Agile equivalent of celebrating negative velocity: technically a number on a chart, but definitely not the direction you want your sprint heading. At this rate, the only thing 'going up' is the team's collective blood pressure and the Jira ticket count
Manager rotates burndown 180° and declares infinite velocity - classic enterprise Agile alchemy
Goodhart’s Law in agile: optimize for “chart go up,” and your burndown converts to a burn-up with velocity measured in scope-creep per sprint
Manager cheers the burndown trending up - peak Goodhart: convert scope creep into a KPI and call it velocity
layoffs chart Comment deleted
CHART MUST GO UP! TIS A BURNUP Comment deleted