
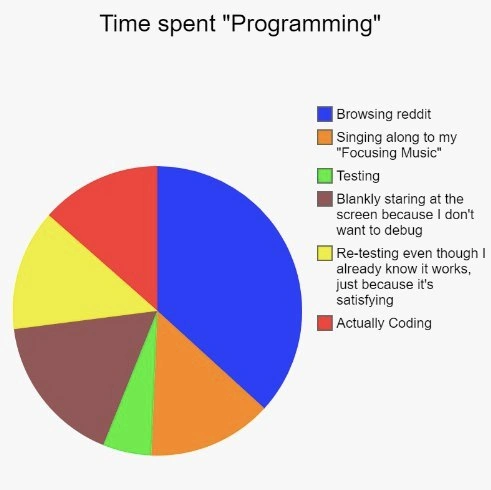
An Honest Pie Chart of a Programmer's Time
Description
A pie chart meme titled 'Time spent "Programming"' that humorously breaks down a developer's daily activities. The largest slice, colored blue, is labeled 'Browsing reddit,' taking up roughly 40% of the chart. The other slices, in descending order of size, are: 'Actually Coding' (red), 'Blankly staring at the screen because I don't want to debug' (brown), 'Re-testing even though I already know it works, just because it's satisfying' (yellow), and 'Singing along to my "Focusing Music"' (orange). The smallest slice, a tiny sliver of green, is simply labeled 'Testing.' This meme resonates with developers of all levels because it satirizes the non-linear and often distraction-filled reality of software development, contrasting with the common perception that programming is 100% focused typing. It highlights universal experiences like procrastination, the mental block before a difficult debugging session, and the small joys of re-running successful tests
Comments
24Comment deleted
The 'staring at the screen' slice should be renamed 'asynchronous distributed systems problem simulation.' It sounds better on a timesheet
Turns out our true bottleneck isn’t I/O or network latency - it’s the blue slice labelled ‘Browsing Reddit’ that’s single-threaded and 100% blocking the event loop
After 20 years in this industry, I've learned that the real skill isn't writing code - it's billing 8 hours for this pie chart while maintaining a straight face during sprint retrospectives
Re-running tests you know pass is the developer's equivalent of opening the fridge again - nothing changed, but the green checkmarks are nourishing
This pie chart is basically a distributed tracing visualization of a developer's attention span - except instead of microservices, we're monitoring micro-distractions. The 'Actually Coding' slice is so small it's practically a rounding error, which explains why our velocity estimates are always off by an order of magnitude. At least we're honest about our O(reddit) time complexity
This pie chart proves the Pareto principle's dark side: 80% distractions for 20% code, with debugging as the event horizon sucking in all motivation
Continuous Delivery of Dopamine: re-run tests until green, avoid the debugger long enough to fall into Reddit - then wonder why “Actually Coding” is a rounding error
DORA forgot the fifth metric: percent of cycle time spent negotiating with your own prefrontal cortex to open the debugger
finally a meme Comment deleted
>Singing along to my "Focusing Music" Holy shit this is so relatable Comment deleted
focused not on coding but on focusing music Comment deleted
Sometimes tasks are so routine that they do not require much focus Comment deleted
That's exactly how buggy, bloated and unoptimized software is created. 😁 Comment deleted
as if unbuggy, not bloated, optimized software exists Comment deleted
→ Linux → htop → pavucontrol → …ok you got me, I don't know anything else. Comment deleted
Such software surely does exist, especially in the field of industrial automation, aerospace, etc., where the cost of errors is very high, and less code means less efforts to validate it, less hardware requirements and more realtime-like performance. Comment deleted
You can write a 10-liner that takes forever to work and leaks memory like a broken pipe. Jk tho, your point is valid. Comment deleted
https://www.youtube.com/watch?v=03mUs5NlT6U Comment deleted
yeah same I made a separate playlist without any songs with lyrics so I can actually get shit done - I still hum along way more often than I should Comment deleted
one big piece missed from chart - suffering from shitty-designed doxygen docs Comment deleted
The author forgot googling and messing up with solutions from StackOverflow. They are not always exactly your case so you need to modify much of them for your task. Comment deleted
sadly, right Comment deleted
I listen to a lot of foreign music as well, but I still get distracted by the vocals. Comment deleted
Where is "googling"?! Comment deleted