Skip to content
DevMeme
4213 of 7435
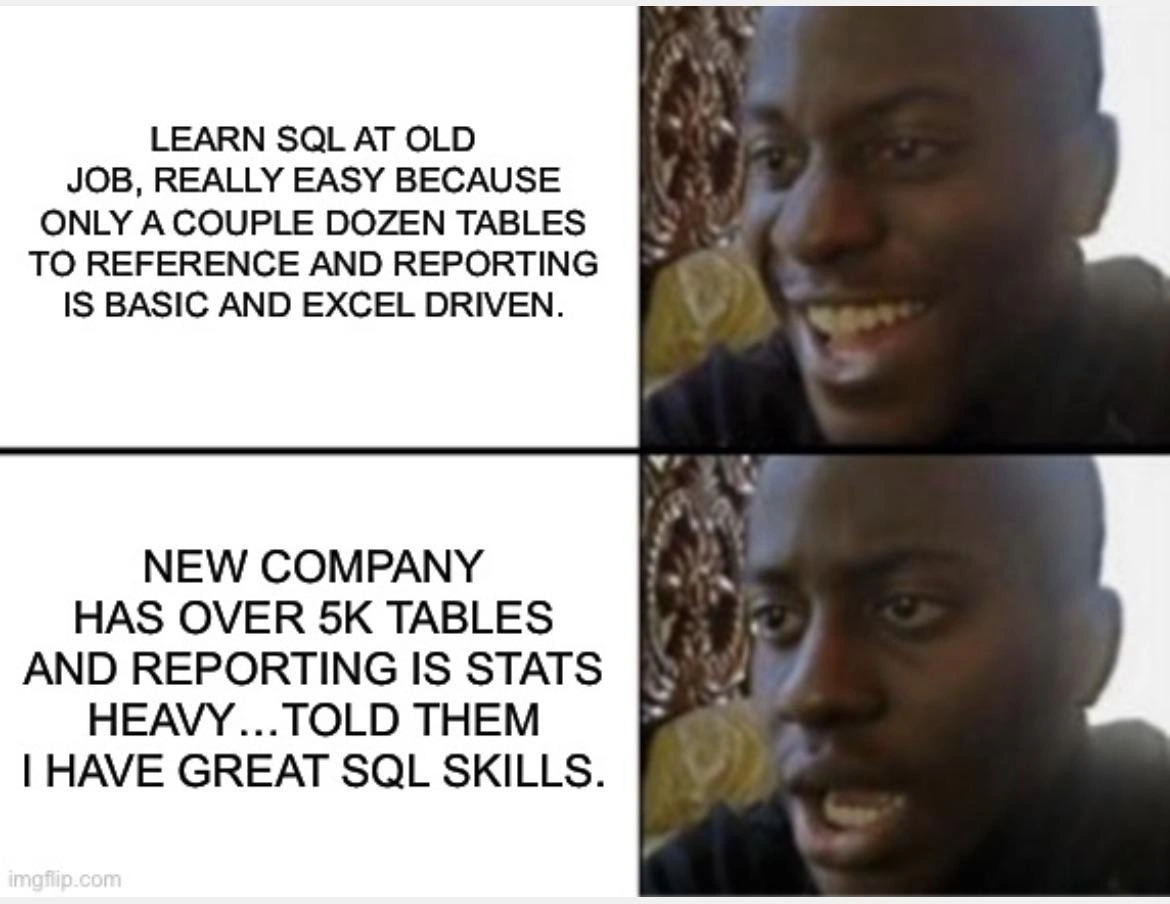
When your 20-table SQL expertise meets a 5,000-table production schema
Databases Post #4600, on Jun 28, 2022 in TG

When your 20-table SQL expertise meets a 5,000-table production schema

Why is this Databases meme funny?

Level 1: In Over Your Head

Imagine you learned how to do a puzzle with just 20 pieces. It was so easy that you felt like a puzzle master, smiling and proud. Now someone hands you a gigantic 5,000-piece puzzle – the pieces cover a whole table – and says, “Here, solve this.” Suddenly, that confident smile disappears and you feel totally lost and shocked. In simple terms, that’s what happened here. The person thought they were really good at using SQL (a language for working with data, kind of like doing puzzles with information) because they only ever dealt with a small, easy database. But when they moved to a new place with a huge amount of data (thousands of little data pieces to put together) it was overwhelming. It’s like boasting you’re a great swimmer after splashing in a small pool, and then being dropped into the ocean – you’d feel scared and realize the ocean is a lot different from the pool. The funny part of the meme is that sudden change from happiness to shock. We find it humorous because we recognize that feeling of being in over your head – when you think something will be easy but then you face a much, much bigger challenge. It’s a way to laugh at the lesson “be careful not to overestimate your skills, or you might end up very surprised!”

Level 2: Excel vs Enterprise

Let’s break down what’s happening in this meme for someone newer to the field. SQL (Structured Query Language) is the language used to communicate with relational databases – basically, it’s how we ask the database questions. In a small environment (like the old job in the meme), you might have only ~20 tables in your database. A table is like a spreadsheet: it has rows and columns, where each row is a record (say, one employee) and each column is a field (like name, age, salary). With only a couple dozen tables, it’s relatively easy to find what you need. For example, maybe there’s an Employees table and a Departments table; if you want a report of employees and their department names, you’d use a JOIN in SQL to connect those two tables on a common field (like a department ID). Here’s how simple it could look:

-- Old job: simple query joining 2 tables
SELECT e.name, e.title, d.department_name
FROM Employees e
JOIN Departments d ON e.dept_id = d.id;

At the old job, reporting was “basic and Excel driven.” This suggests that after running a simple query or exporting data, most of the analysis might have been done in Excel. Excel is familiar and was sufficient because the data was small and straightforward. Maybe you’d pull a list of sales from the database and then use Excel to sum up totals or make a pivot table. The SQL itself never got very complex – you weren’t doing heavy calculations in the database. Learning curve was gentle, and you felt pretty good about your SQL knowledge. That’s why in the top panel the guy is smiling; he thinks “SQL? I got this, it’s easy!”

Now enter the new company. They have over 5,000 tables. That’s an enormous number for a schema – it means the database is extremely big and likely contains data for many different functions of the business. Think of each table as a puzzle piece of information. At the old job you had 20 pieces; at the new job you have a 5,000-piece jigsaw puzzle. Just understanding how those pieces fit together is a huge challenge. Each table might have a specific purpose (for example, there could be a table for every year of data, or separate tables for every region, or just a highly detailed model with lots of reference tables). Database Management Systems like Oracle, SQL Server, or MySQL can handle this many tables, but you, the human, have to figure out which ones to use. It’s overwhelming – hence the shocked expression in the meme’s bottom panel.

Also, the new company’s reporting is described as “stats heavy.” This means they expect you to do advanced calculations on the data. Instead of just listing rows or doing a simple sum, you might need to do things like compute averages, growth percentages, or other statistics within the SQL queries. You could be dealing with complex SQL queries that have multiple joins, subqueries (which are queries inside other queries), and maybe even advanced functions. For example, if you’re asked to produce a monthly sales growth report, you might have to join sales data with time dimension tables, group by month, and calculate percentages – all in SQL. Many large companies also use specialized analytical SQL functions (like window functions) to do things like “give me the running total of sales” or “rank customers by purchase volume”. If you’ve only ever used Excel for that, doing it in pure SQL can be daunting at first.

Let’s visualize a typical complex query in a big schema: you might have to combine data from many tables. Here’s an illustrative snippet (don’t worry about the exact syntax, just notice the number of JOINs):

-- New job: a more complex query with many tables (simplified example)
SELECT c.name, p.product_name, r.region_name, SUM(f.sales_amount) AS total_sales
FROM FactSales f
JOIN DimCustomer c ON f.customer_id = c.id
JOIN DimProduct p ON f.product_id = p.id
JOIN DimRegion r ON f.region_id = r.id
-- ... imagine there are many more tables to join for a full picture ...
WHERE f.sale_date >= '2022-01-01'
GROUP BY c.name, p.product_name, r.region_name;

In this example, FactSales could be a big table storing each sale (with IDs linking to who bought it, what they bought, where, when, etc.). Then there are smaller tables like DimCustomer, DimProduct, DimRegion (dimension tables) that provide details (customer names, product names, region names). This pattern is common in large data warehouses (a kind of database optimized for reporting and analysis). You can see we have multiple JOINs – we’re pulling data from four tables here, and that’s a simplified scenario. In a 5000-table environment, a real query might JOIN a dozen or more tables, or you have to pick exactly the right set out of thousands. Each JOIN must be written carefully: you have to know the correct keys (e.g., join customer_id from sales to the id in customers). If you join the wrong tables or use the wrong keys, the results will be incorrect or even nonsense (for example, accidentally creating a combination that multiplies the number of rows – a common mistake that leads to wildly inflated results). These are the “join nightmares” that the tags mention.

For a junior developer or someone early in their career, the meme’s situation is a lesson in humility and the learning curve. It’s normal to feel confident after learning something in a simple context – like mastering basic SQL in a small project – and then feel completely lost when facing a much larger, real-world system. Think of it like thinking you’re good at video games after beating the easy levels, and suddenly you’re thrown into an expert-level raid with a high-level guild – it’s overwhelming! The meme uses humor to convey that feeling. The guy’s happy face = “I’m an SQL pro!” and then shock face = “Oh no, this is way beyond what I know.” In real life, the way to handle this is to acknowledge that you have more to learn, ask for help, look at documentation (maybe the new company has an internal wiki or ER diagrams for the database), and improve those SQL skills on the job. Career humor like this resonates because almost everyone has had a moment of realizing they weren’t as prepared as they thought. It’s a combination of learning curve and a bit of impostor syndrome (feeling like “I said I could do this, but can I really?”).

So, “great SQL skills” on a résumé might mean very different things depending on context. The meme’s captions highlight that contrast: small pond vs. ocean. It’s poking fun at the mismatch of expectations – the protagonist talked himself up, and now has to face an incredibly challenging database. The good news? He’ll definitely learn a ton and eventually grow into those SQL skills for real – after the initial panic, of course!

Level 3: Schema Shock Syndrome

This meme lands with experienced developers because we’ve all seen the overconfidence that comes from working in a simple environment – and the rude awakening when stepping into a complex one. The first panel’s smiling face represents that blissful ignorance: at the old job, writing SQL was a breeze. Only a couple dozen tables? Easy – you probably knew each table’s name by heart. Reporting was basic and Excel-driven, meaning you’d run a simple query or two and dump the results into Excel for pivot tables or charts. No elaborate joins, no performance worries; life was good. You start thinking “SQL is pretty straightforward, I have great SQL skills!” – classic overconfidence bias setting in. Maybe you even put “SQL expert” on your resume after mastering a few SELECT statements on a tiny schema.

Then comes the schema shock at the new company. Five thousand tables? You can almost hear a record scratch in your mind as your smile drops (just like the meme’s second panel). This is an enterprise data warehouse or a gigantic production Database Management System that’s been accumulating tables for years, if not decades. Perhaps each department or microservice added their own tables, leading to colossal table sprawl. Suddenly your old tricks don’t cut it. Instead of joining sales with customers on a single key, you might have to join 10+ tables across various schemas just to assemble one meaningful report. It’s common in large enterprises to have separate tables for every data slice: customer info, transactions, products, addresses, demographics, you name it. Welcome to join nightmare city – population: you and your SQL editor at 2 AM, wondering why that 12-table join query returns 10 million rows (and whether those duplicates are your fault).

The humor here is also about the mismatch of expectations. The newcomer proudly told the new company “I have great SQL skills,” not realizing that SQL in the real world isn’t just writing a query – it’s understanding a vast schema, knowing which tables matter, and dealing with performance tuning. Reporting being “stats heavy” implies they need complex aggregations or statistical calculations directly in SQL. Maybe the new job expects familiarity with things like window functions (RANK(), PERCENTILE_CONT() etc.), or writing efficient subqueries for analytics. At the old job, “stats” might have meant a SUM or AVG in Excel; at the new job it could mean calculating month-over-month growth, standard deviations, or cohorts with pure SQL. That’s a whole new ballgame.

From a seasoned developer’s perspective, this scenario is too real. We’ve seen juniors or new hires face this: their eyes widen seeing the convoluted ERD (Entity-Relationship Diagram) of an enterprise system – a spiderweb of tables and foreign keys. It’s one thing to memorize a schema of 20 tables; it’s another to comprehend even a corner of a schema with thousands. In practice, you start writing queries against the information_schema (the database’s metadata) just to find which table might contain the data you need:

-- When you're lost in a 5000-table schema, you do meta-queries:
SELECT table_name, column_name 
FROM information_schema.columns 
WHERE column_name LIKE '%customer_id%';

You might discover five different tables that sound like they relate to customers, and now you have to figure out which one to use (or how to join them all correctly). It’s a humbling experience. The meme’s punchline – the shocked face – is that moment you realize “Oh no... what have I gotten myself into?” The confident grin is wiped away by the reality that SQL difficulty grows non-linearly with schema size. Each additional table isn’t just another item in the FROM clause – it’s potentially a new join condition to get right, a new set of data nuances to understand (like does orders.customer_id link to customers.id or clients.id? Are those the same? Why do we have both?). Mistakes in this environment can lead to double counting or missing data in reports, and debugging a query across so many tables is a nightmare (join_nightmares, indeed).

Seasoned devs also know the career angle here: claiming “great SQL skills” in an interview is risky if your experience is limited. It’s like saying you’re fluent in a language because you learned a few phrases. The hiring team might throw you into the deep end – the big production schema – and expect you to swim. And while the meme is light-hearted, there’s an underlying dark humor: we’ve all had that moment of impostor syndrome when we realize the job is way more complex than we anticipated. The difference is, a veteran will nod knowingly at the meme and think, “Yep, been there, done that – welcome to the real world of enterprise databases, kid.” The meme gets a laugh because it captures a common engineer rite of passage: getting humbled by a monstrous codebase or database after cruising through a simpler one. It’s a snapshot of that lesson: never underestimate a system until you’ve seen its true complexity.

Level 4: Joinpocalypse Now

In the relational algebra underpinnings of SQL, adding more tables to a query isn’t just a linear increase in complexity – it’s a combinatorial explosion. A small 20-table schema is a neat little graph of relations; a 5,000-table enterprise schema is a vast web where even the query optimizer starts sweating. Every time you add another table to a JOIN, the database’s planner has to consider exponentially more ways to execute that query. In fact, the problem of finding the optimal join order is NP-hard – meaning the database must rely on heuristics and cost estimates instead of brute-forcing through all possibilities (which would be joinpocalypse for real). The optimizer uses dynamic programming (e.g. the classic Selinger algorithm from 1979) to prune the search space, but with so many tables, it’s essentially solving a mini-traveling-salesman problem for your query. One wrong turn in the join order and you’ve got a Cartesian product the size of a small moon.

Enterprise databases achieve their sprawl by strict normalization: each entity and relationship gets its own table (or three). In theory, higher normal forms eliminate duplicate data, but taken to the extreme, you end up with thousands of tables for every conceivable data point. 3NF, BCNF – sure, no update anomalies, but now a simple report means joining ten tables just to get a user’s full profile. The humor in this meme hides a hard truth from database theory: more tables = more joins, and join complexity grows non-linearly. Imagine the database as a huge interconnected network; writing a query on a 5k-table schema is like plotting a path through a densely connected graph. There’s a combinatorial explosion of join paths and foreign key relationships to navigate.

And then there’s the performance aspect: a naive query that might work on 20 small tables can bring a big system to its knees when those tables are huge. The query planner has to choose between a hash join, merge join, or nested loops, decide which indexes to use, and possibly split the query into map-reduce steps if it’s a distributed SQL engine. For heavy analytical reporting (“stats heavy” as the meme says), you’ll likely need window functions (ROW_NUMBER(), AVG() OVER (PARTITION BY ...)), advanced grouping sets (CUBE, ROLLUP), or even materialized views to pre-aggregate data. All of this pushes SQL beyond the trivial SELECTs one learns on a toy schema. When you boast “great SQL skills” but only have sandbox experience, you’re basically bringing a nerf gun to a data warehouse gunfight. The veteran engineers chuckle because they know the theoretical underpinnings – and the sheer algorithmic complexity – will wipe that grin off in a hurry when real-world scale hits. In summary, the meme humorously underscores a principle from database theory: what works simply on a small scale can become intractably complex in the real world of table sprawl and massive schemas.

Description

Two - panel reaction meme with a vertical split: text on the left, a man’s facial reaction on the right. Top panel shows him happily smiling beside the caption, "LEARN SQL AT OLD JOB, REALLY EASY BECAUSE ONLY A COUPLE DOZEN TABLES TO REFERENCE AND REPORTING IS BASIC AND EXCEL DRIVEN." Bottom panel shows the same person suddenly staring ahead in shock (face partially blurred), next to the caption, "NEW COMPANY HAS OVER 5K TABLES AND REPORTING IS STATS HEAVY…TOLD THEM I HAVE GREAT SQL SKILLS." The humor comes from overestimating one’s SQL proficiency after working with a tiny schema and then confronting an enterprise data warehouse with thousands of tables, complex joins, and heavy analytics. Technically, it highlights the gulf between simple Excel-driven querying and large-scale relational database design, reminding engineers that SQL difficulty grows non-linearly with schema size and reporting complexity


Comments

6
Anonymous ★ Top Pick I told them I’m great at SQL - turns out the real skill here is archaeology: excavating 5,000 tables to find the one “user” relic that won’t trigger a Cartesian-product boulder the moment I hit JOIN
  1. Anonymous ★ Top Pick

    I told them I’m great at SQL - turns out the real skill here is archaeology: excavating 5,000 tables to find the one “user” relic that won’t trigger a Cartesian-product boulder the moment I hit JOIN

  2. Anonymous

    The difference between "I know SQL" and "I know SQL" is about three years of therapy and a deep personal relationship with the information_schema database

  3. Anonymous

    Going from a 'couple dozen tables' to 5K+ tables is like confidently saying you know Git because you've mastered 'git add' and 'git commit' on your personal project, then joining a company where the monorepo has 847 active branches, a merge conflict archaeology team, and someone's still debugging why a rebase from 2019 occasionally resurrects deleted code. Suddenly your 'great SQL skills' feel like bringing a SELECT * to a window function fight - sure, it technically works, but the query planner is judging you, the DBA is crying, and you're about to learn what 'execution plan analysis' really means when your JOIN takes longer than the sprint

  4. Anonymous

    Old job: SELECT *; new job: 5k‑table warehouse with SCD2 dims, a subway‑map ERD, and JOINs that trigger cost‑based existential crises

  5. Anonymous

    LeetCode SQL: 3-table breeze. Prod: 50-table joins that make your query planner beg for mercy

  6. Anonymous

    Enterprise SQL is where “I joined a few tables in Excel” becomes a three-hour EXPLAIN-plan therapy session for late-arriving facts across twelve schemas and a data dictionary last updated in 2014

Use J and K for navigation