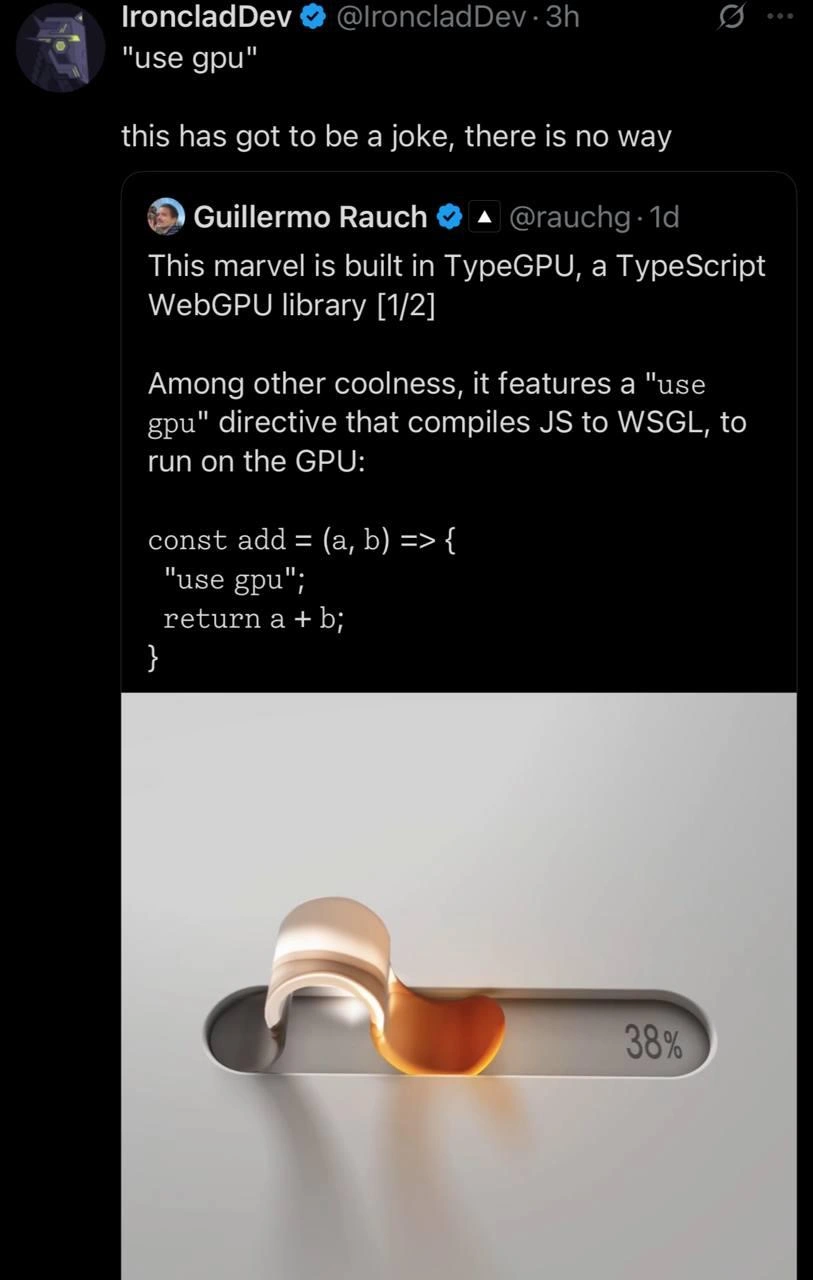
Evidence of a System Under Duress: GPU Pushed to 95% Utilization
Why is this Performance meme funny?
Level 1: Firehose for a Sip
Imagine you ask for just a sip of water, but instead someone turns on a big fire hose and drenches you head to toe. That's overkill, right? You only wanted a little bit, but you got way, way more water (and power) than necessary. This meme is making the same kind of joke. The person "only asked for a preview" – basically a quick peek at something – but the computer revved up to full blast (using 95% of its power, like a fire hose blasting). It's funny (and a bit shocking) because the response is ridiculously out of proportion to the request. We can't help but laugh at how the poor computer went all-out when it really didn't need to. It's like using a cannon to kill a mosquito: effective, maybe, but definitely too much for a small task. That exaggerated mismatch between a tiny ask and a huge reaction is the whole joke!
Level 2: Task Manager Tales
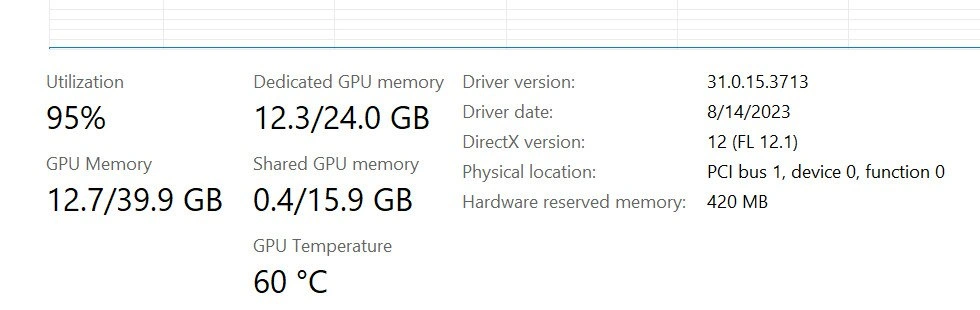
Let's break down what this image is showing and why it's surprising. This is a snapshot from Windows Task Manager (the performance monitoring tool that shows what your computer's hardware is doing). We're looking specifically at the GPU section. A GPU (Graphics Processing Unit) is a special processor dedicated to graphics and other heavy computations. It’s like your computer’s muscle for math – often used for rendering images and videos or even training AI models.
Now, the numbers in the screenshot: Utilization 95% means the GPU is 95% busy. In other words, almost all of its processing power is being used at that moment. That's extremely high – usually you'd only see a number that large when running a demanding video game, doing a 3D render, or crunching a big dataset. Seeing 95% utilization when you thought you were doing something minor (like just getting a quick preview of a file or effect) is what makes this meme funny. It's like expecting a light jog but finding out your PC is sprinting at full speed.
Next, GPU Memory 12.7/39.9 GB – this indicates how much memory the GPU is using out of the total it could use. This system has up to ~40 GB of GPU memory available, but that's split into two types:
- Dedicated GPU memory 12.3/24.0 GB: This is the GPU's own super-fast memory (called VRAM) on the graphics card. Here 12.3 GB out of 24 GB is in use – so about half of the card's VRAM is filled with data for this task. That's a lot of data! (For context, many entire video games might not use 12 GB of textures and models at once.)
- Shared GPU memory 0.4/15.9 GB: This is regular system RAM that the GPU can borrow if it runs out of its own VRAM. Only 0.4 GB is being used as shared memory, meaning almost everything the GPU needs is fitting in its dedicated 24 GB of VRAM. Shared memory is slower to access than VRAM, so it's actually good news that this number is low; it means we haven't completely exhausted the GPU's native memory yet.
Then we have GPU Temperature 60 °C. That's the temperature of the GPU chip. 60°C (about 140°F) is warm but generally safe and normal when the GPU is working. It tells us the GPU is under load (when idle, it would likely be much cooler, maybe around 30-40°C). Under a really heavy workload, many GPUs run at 70–80°C or even higher (they're designed to handle heat up to a certain point). So 60°C shows the GPU is definitely active, though it's not at its absolute limit. It might be that this was a sudden spike to 95% usage and the temperature was climbing, or the cooling system is doing a great job.
On the right side, we see some technical details:
- Driver version: 31.0.15.3713, Driver date: 8/14/2023 – A driver is the software that helps Windows communicate with the GPU. These numbers identify the exact version of that software. An updated driver (August 2023 in this case) suggests everything is up-to-date. It's basically telling us the GPU is using recent, optimized instructions and it's not an old driver causing weird issues. In short, the GPU is working hard on purpose, not because of a buggy driver.
- DirectX version: 12 (FL 12.1) – DirectX is a collection of tools Windows uses for graphics and multimedia. Version 12 is the latest major version, and "Feature Level 12.1" means the GPU supports almost all the advanced features that DirectX 12 can offer. This is just confirming the graphics card is modern. (If this were older, say DirectX 11, it would be a less capable card. But here it's top-tier.) This doesn't directly affect the numbers, but it sets the stage: whatever the GPU is doing, it can utilize the latest graphics techniques.
- Physical location: PCI bus 1, device 0, function 0 – This is like the GPS coordinates of the GPU on the computer's motherboard. It’s plugged into a slot (PCI Express slot) which in technical terms is at bus 1, device 0. For everyday purposes, you don't need to worry about this. It's mostly useful if you had multiple GPUs or if you're digging into hardware configuration. In a single-GPU system, it's often bus 1, device 0 for the primary graphics card.
- Hardware reserved memory: 420 MB – This means 420 MB of memory is set aside by the system for its own use and cannot be used by applications. Essentially, out of the GPU's total memory, a little chunk is reserved for critical things (like the system's graphics needs or certain low-level operations). The Task Manager subtracts this out when it reports the 24.0 GB total. It's normal to have some small portion reserved; you can think of it like how your car’s fuel tank might always leave a little bit that you can't use so that the engine doesn't run dry.
To put all this plainly: the person running this computer simply tried to get a "preview" of something – usually that means a quick, partial look at a result (like a low-quality render of a 3D scene, a snippet of video processing, or a single pass of an AI model to see if it works). But looking at these monitoring stats, we can tell the computer had to engage the GPU almost fully, use a large chunk of the GPU's memory, and even warmed it up to 60°C. It’s basically like revving a car's engine to near maximum just to see if everything's okay in a short test drive.
For a newcomer to these concepts, the meme is highlighting a surprise: sometimes what seems like a small request from the user can cause a big effort under the hood. The Task Manager performance panel is how we observe and confirm that. This falls under the realm of observability and monitoring – using tools to watch what your system is doing. And indeed, the Task Manager here tattled that "hey, your GPU is working really hard!" The joke is that a preview, which we normally expect to be quick and easy, ended up being so heavy that it pushed high-end hardware to its limits. It's a lighthearted reminder that computers will do exactly what we ask them to — even if that means going overboard — so it's good to keep an eye on those performance graphs to know what's really happening.
Level 3: Preview vs Reality
Any seasoned developer or system engineer can chuckle at this because it's a classic case of expectation vs. reality in software performance. You think you're doing something minor – "just generate a quick preview" – and suddenly your expensive hardware sounds like a jet engine and your GPU is essentially running a marathon at sprint speed. The combination of the phrase "I only asked for a preview" with a screenshot showing GPU utilization at 95% is the punchline. It's funny precisely because it's true: modern applications often demand maximum horsepower from our machines even for seemingly trivial tasks. Instantly, the fans ramp up and the system starts to toil as if you launched a full production workload, pushing toward its thermal and memory ceilings before you can blink. Seeing that 95% number for a "little preview" is equal parts alarming and comical.
Why is this so relatable? Because we've all seen it happen. Maybe you opened a 3D modeling program to preview a textured object, or you ran a machine learning script to test a model on one sample, or you enabled some fancy Excel plugin that offloads calculations to the GPU (an ill-advised experiment, perhaps). Instantly, the fans whoosh and the PC starts working hard. There's that moment of "Uh oh, did I just accidentally start the entire render or training job?" But no – it's just how things are nowadays. Observability tools (i.e. monitoring software) like Task Manager make this obvious: you glance at the performance tab and see that big 95% number and a chunk of your 24 GB VRAM gobbled up. It's a mix of surprise and here we go again.
The humor (and slight horror) comes from industry patterns we know too well. Software has a tendency to use all the resources available, often because developers assume more hardware usage means faster results. It's an open secret that previews aren't always lightweight. Under the hood, many apps simply reuse the real rendering or computation pipeline with only minor tweaks. It's easier than writing a whole separate mini-version of the algorithm. Picture the code behind the preview feature looking like:
def show_preview(scene):
# Ideally this would use a simplified pipeline, but let's just reuse the full one
return render_scene(scene, quality="ultra")
The result? The "preview" might run at almost the same cost as the real deal. For example, game developers might neglect to cap the frame rate or detail level in a preview or menu screen — leading the GPU to compute hundreds of frames per second of a scene you barely even interact with. (There are actually horror stories of game menus driving GPUs to 100% usage because nothing told them to slow down!) In data science or AI, you might load a huge model just to test it on one input; frameworks will happily leverage the GPU fully to give you that answer quickly, even if you didn't technically need all that speed for a one-off test.
From an engineering standpoint, fixing this isn't trivial. Introducing a "lite mode" for previews means extra development work and maintenance complexity. Many teams skip that unless constraints (like battery life on laptops or costly cloud GPU time) force their hand. There's also the user-experience expectation: people want the preview to look almost as good and be as fast as the final result. If the preview were too low-quality or sluggish, it might defeat its purpose. So the incentives often line up to just throw full power at the problem and get a snappy, high-fidelity preview, hardware stress be damned. In theory, best practices suggest adding throttling or level-of-detail reduction for previews (to improve efficiency and user comfort), but in practice those optimizations often get cut when deadlines loom or if they complicate the code.
Every experienced dev has that story: hitting "Preview" and suddenly hearing the PC's fans roar to life. It's almost a rite of passage. We learn to be slightly wary of demo modes or previews in heavy software, because sometimes they will spin up all the compute you have. It's both a little terrifying and amusing. The meme nails this shared experience. One moment you're innocently clicking a button, the next it feels like you've triggered a rocket launch sequence. For those of us who have debugged performance issues or been on call, seeing a system unexpectedly max out triggers a mix of oh no, not again anxiety and of course this happens laughter. We laugh because we recognize the scenario: the computer is doing exactly what we told it to, technically, but with zero chill. In an era where even web browsers can tap the GPU and a simple notebook script can tax a high-end graphics card, a 95% utilization "just for a preview" feels par for the course. It's a tongue-in-cheek reminder that performance optimization is often an afterthought, and our beefy hardware will get pushed to its limits even during what was supposed to be a small test. At least Task Manager was there to blow the whistle – without that monitoring view, one might not even realize this little preview was secretly a resource-guzzling beast.
Level 4: Full Core Press
Under the hood, GPUs are built for brute-force parallelism and will eagerly utilize nearly 100% of their capacity whenever a workload is thrown at them. Unlike a CPU – which might only use one core for a light task – a GPU with thousands of shader cores doesn't do anything by half measures. If a program sends even a "small" preview job (say, a quick 3D render or an AI inference) to the graphics card, the driver schedules hundreds or thousands of threads across the GPU's streaming multiprocessors. Unless a program explicitly throttles itself or uses a simplified algorithm for previews (a form of performance optimization), the GPU will always try to finish the job as quickly as siliconly possible by engaging all resources. The result? Utilization 95% in an instant, as every available ALU (Arithmetic Logic Unit) starts crunching numbers in parallel (that remaining 5% headroom is probably just the card politely saving enough juice to keep your display refreshing – including that Task Manager window that's tattling on it).
This screenshot is essentially observability at the hardware level: Windows Task Manager is showing that the GPU pipeline is almost fully saturated. Modern workloads – especially in graphics and machine learning – scale up to fill the device's throughput. A preview might reduce resolution or run fewer iterations, but the GPU doesn't exactly idle; it still runs the same complex shaders or matrix multiplications, just maybe for a shorter time. The underlying algorithms (like a ray tracing shader or a neural network forward pass) are computationally intense. So whether it's one frame or a hundred, the GPU fires on all cylinders to produce the result as fast as possible. It's a bit like an engine that revs to high RPM even for a quick trip around the block.
Memory behavior on modern GPUs also contributes to this heavy footprint. Notice the Dedicated GPU memory at 12.3/24.0 GB – that's about half of a high-end card's VRAM completely engaged just for this preview task. GPUs often preallocate large buffers and load whole datasets or textures into VRAM to avoid slow transfers over the PCIe bus. If you're doing a "preview" of a machine learning model, the entire model's parameters (potentially gigabytes) might be loaded into memory. If it's a graphics preview, high-resolution textures, geometry, and shader programs likely still get copied over. The GPU's philosophy is better to have it and not need it than to need it and not have it. Only a tiny 0.4 GB of Shared GPU memory (system RAM that the GPU can borrow) is in use, which means the workload fits within the card's own memory. In other words, the task is heavy but still within the GPU's on-board capacity – had it needed more, it would start spilling into slower shared memory over the PCI bus.
Even the GPU Temperature 60 °C reading hints that the card is actively working but still within a safe thermal range (many GPUs can run at 80°C or higher under sustained load). At 95% utilization, the cooling system is probably ramping up; 60°C suggests either a brief spike or a very well-cooled rig handling the heat. And yes, that DirectX version: 12 (FL 12.1) and the up-to-date Driver version: 31.0.15.3713 (from August 2023) tell us this is a modern graphics card with current drivers. In plain terms, it's using the latest graphics API and feature set, which means it can leverage advanced rendering or compute capabilities – no old driver shenanigans here. All of this confirms that nothing about this is a fluke or an outdated bug; it's just how the hardware and software behave when asked to do something computationally intense.
There's an old saying among performance engineers: workloads expand to fill the compute available. GPUs embody this principle. They are optimized to chew through parallel tasks as fast as possible, which often manifests as near-maximum utilization whenever they're not outright idle. The humor here is rooted in a hardware truth: even if you "only" asked for a preview, the GPU heard "Give it everything you've got!" by design. It's a performance paradox built into modern computing – and the Task Manager's metrics, our trusty monitoring tool, are confirming it in black and white.
Description
This image is a screenshot of a GPU performance monitoring tool, likely from Windows Task Manager, displaying technical statistics for a graphics card under heavy load. The key metrics show a 'Utilization' of 95%, 'Dedicated GPU memory' usage of 12.3 GB out of 24.0 GB, and a total 'GPU Memory' footprint of 12.7 GB out of 39.9 GB. The GPU temperature is listed at a stable 60°C. Other details include the driver version, DirectX version (12), and a 'Hardware reserved memory' of 420 MB. While not explicitly stated, this image is contextually linked to discussions about poorly optimized software, like the game 'Cities: Skylines II', that consumes excessive resources. For a technical audience, this isn't a badge of honor for the software; it's an indictment of its inefficiency. Seeing a high-end 24GB card almost fully utilized points to significant optimization issues, potential memory leaks, or an unrefined rendering pipeline, making it a relatable symbol of frustratingly demanding applications

Comments
7Comment deleted
The hardware reserved memory is 420MB because the GPU needs to chill out after running at 95% utilization just to render a traffic jam
95 % GPU usage just to render the metrics UI - must be running Electron
That moment when you realize your GPU at 95% utilization and 60°C is handling your ML training better than your Kubernetes cluster handles a health check endpoint
95% GPU utilization at only 60°C? Either you've got the cooling solution of a data center or your monitoring software is as optimistic as your sprint velocity estimates. Meanwhile, the 420 MB of hardware reserved memory is just sitting there like that one microservice nobody remembers deploying but everyone's too afraid to shut down
95% GPU utilization and 12.3/24GB VRAM at 60°C - the unmistakable signature of a quick local LLM experiment that quietly promoted your dev box to MLOps staging while finance celebrates reduced cloud spend
95% util on 24GB VRAM: Because sharding to a cluster is for teams with budgets, not solo architects YOLOing Llama fine-tunes
Task Manager says “39.9 GB GPU memory”; the model hears “24 GB VRAM plus 16 GB PCIe latency emulator” - batch_size still 1