A GitHub Contribution Graph's Cry for Help
Why is this MentalHealth meme funny?
Level 1: Sticker Chart SOS
Imagine you have a big calendar on the wall, and every day you do your chores or homework, you get to put a big green sticker on that day. You start filling the calendar with stickers to show how hardworking you are. Now picture that someone’s calendar is almost full of these green stickers – it looks like they’ve been super busy and everyone might think “Wow, great job!” But then you step back and notice the pattern of the stickers actually spells out the words “HELP ME.” 😧 It’s funny in a cheeky way because the person used their reward chart (which normally shows how much they’ve achieved) to secretly say they’re tired or need help. It’s like when a kid does so many chores that they cover the chart in stars, but in doing so they write a hidden message saying they really need a break. The reason it’s amusing is because it flips something meant to be positive – a full chart of gold stars – into an S.O.S. sign. It’s a simple way to show that even if someone looks like they’re doing great on the outside, they might be feeling overwhelmed and asking for help on the inside.
Level 2: Green Square Game
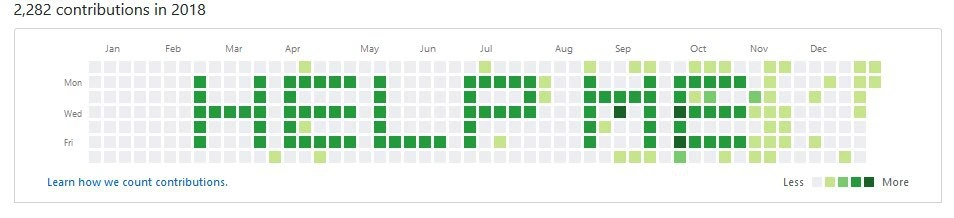
This image is taken from a GitHub profile’s contribution graph, which is basically a calendar showing how many code contributions (like commits or code pushes) a developer makes each day. Each day is a small square: grey means no activity, light green means a few commits, and dark green means a lot of commits on that day. GitHub uses this grid to give users a quick visual summary of their coding activity over the year. It’s like a little game or scoreboard built into your profile – the more you commit, the greener your calendar looks. Many new developers get excited about filling up this chart with green squares, treating it almost like earning points or maintaining a streak. For example, if you code every day for a week, you get a solid row of green blocks. Do it for months, and your profile turns into a big green mosaic. It’s a fun dev community trend to share screenshots of a fully green year or creative patterns made out of these squares, often tagged as #codinghumor or #gitHub fun.
In this meme, the developer turned the contribution calendar into a canvas for a very clear message: “HELP ME.” The dark green squares are arranged to form those letters across the months. That means on certain days they made a bunch of commits (to get dark green pixels) and on other days they purposely made none (leaving grey gaps) – so that when you look at weeks or months as a whole, you can read the text. This kind of commit art requires planning. The person likely figured out which dates correspond to which pixel in the grid and then made sure to commit on those dates. It might even involve making dummy commits (for example, pushing an empty commit or a trivial change) on specific days just to color that square green. Some developers have done things like this for fun – even spelling words like “LOL” or making pixel drawings on their GitHub graphs. It’s a playful way to bend the rules of version control activity for a joke.
But the phrase “HELP ME” isn’t just random – it’s highlighting a serious issue in developer culture. Burnout is when someone feels exhausted, overworked, and mentally drained by their job or projects. In tech and open-source communities, there’s often pressure to keep coding constantly, contribute to projects, and not “fall behind.” The green-square game can become stressful: imagine feeling like you must make a commit every day to keep your streak going or to impress recruiters looking at your profile. It can turn into anxiety about even one grey square (meaning you took a day off). Here, the joke is that the developer’s profile looks super active (over 2,000 contributions in a year is a lot!), but they’re using that very activity to spell out that they’re struggling. It’s a bit like smiling on the outside (everything’s green and good) while crying for help on the inside. The meme is relatable for many coders who have felt the pressure to always be productive. It’s a reminder that seemingly high DeveloperProductivity – like tons of commits – doesn’t always equal healthy or happy. And in our dev communities, people are increasingly talking about MentalHealth and work-life balance. So, seeing a cry for help hidden in a GitHub graph hits close to home and makes this meme both funny and poignant to anyone who’s spent late nights trying to keep their code streak alive.
Level 3: Green Red Flags
At first glance, a GitHub contribution graph awash in green squares looks like a badge of honor for a prolific developer. In this meme though, those green squares literally spell out "HELP ME", turning that badge into a neon burnout warning. This is a cheeky form of commit art – using daily commit logs as pixels to draw words – and here it's a darkly humorous one. Seasoned engineers immediately recognize the satire: an apparently stellar commit count ("2,282 contributions in 2018" bragged by the header) is hiding a desperate plea. The developer has painstakingly arranged commits from March through October so the dense dark-green squares form letters on the calendar grid. Instead of the usual scatter of contributions, we see an SOS message embedded in the very metric that’s often glorified. It’s a perfect illustration of how DevProductivity metrics can mask personal despair – a green graph that’s really a red flag.
Behind the laugh is a grim truth from the world of version control and developer culture. GitHub’s contribution calendar was meant to encourage consistent activity, even gamifying coding with streaks and green-square counts. Many devs (and even managers) obsess over these graphs as a measure of worth – How active is this engineer? More green = more productive, so they think. This meme flips that script: all those contributions, yet the message is literally “I’m not okay.” The humor lands because veteran developers know the culture of chasing green squares can lead to anxiety and overwork. It’s a silently understood joke in dev communities that burnout can hide behind a wall of commits. The MentalHealthInTech angle is painfully real: you might be merging code every day, maintaining that streak, and still feel miserable. Seeing “HELP ME” spelled out underscores that the pressure for constant output – those endless commits, the 5pm pushes, the weekend fixes – might look like dedication but often it’s a cry for relief.
Technically speaking, pulling off this stunt is both creative and telling. The GitHub contributions calendar has rows for each weekday and columns for weeks. By timing commits on specific days, the developer has drawn each letter H-E-L-P M-E across the grid. The darker the green, the more commits that day – so to draw bold letters, they likely made multiple commits on those exact dates, and zero on days meant to stay blank (grey). Imagine the planning (or automation) required to ensure certain squares were dark green while neighbors stayed white – it’s like writing a secret message in a pixelated font where each commit is a pixel. In fact, some developers script this kind of thing: e.g., setting environment variables like GIT_COMMITTER_DATE and GIT_AUTHOR_DATE to forge commits on past dates, crafting a pattern in the calendar. It’s a tongue-in-cheek hack of the version control system’s gamification. The result is both impressive and ironic: a GitHub profile that screams for help through the very data points that usually signal accomplishments. Senior engineers chuckle (or wince) because they’ve been there – pouring countless commits into projects, getting praised for productivity, all while silently thinking “Please, I need a break.” This meme beautifully captures that duality with some dark developer humor: the Git repository’s activity log has literally become a burnout billboard. And of course, the little blue link “Learn how we count contributions” sitting underneath comes off as extra irony – as if GitHub is oblivious to the human story behind those numbers.
Description
This image is a screenshot of a GitHub user's contribution graph for the year 2018. The header indicates '2,282 contributions in 2018'. The graph itself, a grid of squares representing days of the year, uses varying shades of green to indicate the volume of commits made on each day. The contributions are not random; they are intentionally patterned to spell out the words 'HELP ME' in large, block letters across the calendar year. This is a form of 'commit art,' where developers manipulate their commit history to create images on their public profile. The humor is dark and poignant, contrasting the appearance of high productivity (over 2,000 contributions) with a desperate message. It serves as a commentary on developer burnout, the pressure to maintain a 'green' contribution graph, and the potential for a public profile to hide private struggles within the tech industry
Comments
7Comment deleted
This developer has mastered the art of version control. They've branched off from reality, committed to a cry for help, and are waiting for someone to merge in a solution
Hit my Q3 OKR by wiring a GitHub Action to spam empty commits that spell “HELP ME”; management applauded the throughput, staff engineers opened a Sev-1 for “critical human resource leak.”
Nothing says 'senior engineer' like having 365 days of green squares that are 90% README typo fixes and whitespace commits because apparently my professional worth is measured by my ability to maintain a Tamagotchi for code
When your GitHub contribution graph becomes a literal cry for help, but your manager just compliments you on maintaining such consistent commit velocity. This is what happens when we optimize for green squares instead of sustainable engineering practices - developers resort to encoding distress signals in their activity heatmaps like some kind of version-controlled Morse code. The real tragedy? Those 2,282 contributions probably include 2,000 'fix typo' commits and 200 force pushes to get the letter spacing just right
2,282 contributions and the GitHub heatmap spells HELP - when you measure productivity by green squares, the CI bot starts doing incident comms
When KPIs become “green squares per quarter,” the architecture writes itself: a cron of git commit --allow-empty painting HELP ME across the calendar
When your resume's code section is blank, but the heatmap screams 'hireable' in git-green Morse code