Skip to content
DevMeme
4646 of 7435
Inhaling endless production logs during late-night incident debugging like a champ
Observability Monitoring Post #5094, on Jan 6, 2023 in TG

Inhaling endless production logs during late-night incident debugging like a champ

Why is this Observability Monitoring meme funny?

Level 1: Drinking a Waterfall

Imagine trying to drink water from a waterfall – the water is gush­ing out so fast and there’s so much of it that you can barely get a sip. You’d get soaked, right? This meme is funny for a similar reason. It shows a person (the SpongeBob character) trying to swallow an enormous flow of information (the "logs from production") all at once. It’s like if you spilled a giant box of LEGO pieces and then tried to pick them all up by vacuuming them in one go – a crazy, cartoonish solution! The engineer in the joke is doing something superhuman and silly: gobbling up tons of computer messages frantically. We laugh because it’s an exaggerated, goofy way to show how desperate and overwhelmed one can feel when fixing big problems. In simple terms, it’s funny because it’s a huge overload of stuff, and the person is tackling it in a wild, impossible way – just like trying to drink a waterfall!

Level 2: Midnight Log Diving

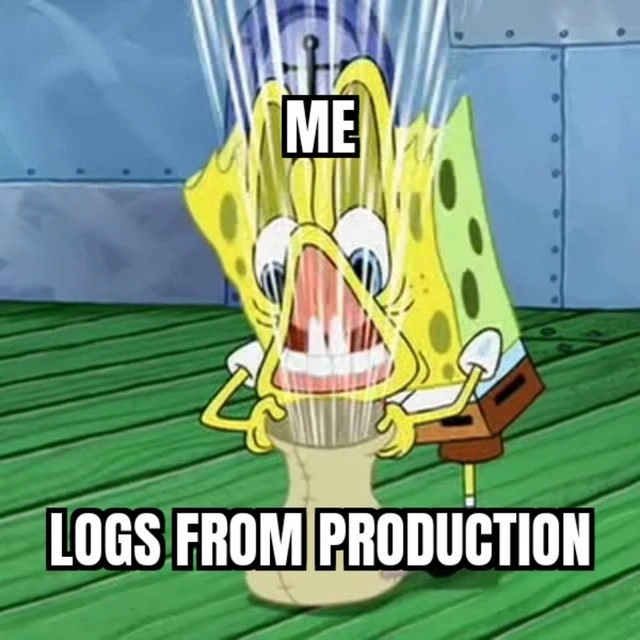
Now let's break this down for a newer developer or someone early in their career. In this meme, SpongeBob represents a developer (labeled as "ME"), and he’s shown literally vacuuming up a sack of something with extreme intensity. The sack is labeled "LOGS FROM PRODUCTION," meaning all the log data coming from a production system. Production refers to the live, real-world environment where the application or website is running for users. So production logs are the records of events and messages that the software writes out while running live – things like error messages, warnings, or just info statements that developers put in the code to say "Hey, this happened."

In a normal situation, you might look at logs in a calm way, maybe checking a few lines to see if everything's okay. But in an incident (when something is broken or an alarm went off), especially during late-night on-call duty, engineers often have to investigate quickly. On-call duty means it's your turn to be available 24/7 to respond if the system breaks. Imagine your phone buzzing at 2 AM: a major error is happening on the website. You jump out of bed, open your laptop, and start looking for what’s wrong. Where do you look? Logs! They're like the diary of the application telling you what it was doing and what might have failed.

The funny (and painful) part is that these logs can be HUGE – thousands or even millions of lines, especially in large systems. Logging is the practice of writing out these messages, often into a file or a logging system. Over time, logs accumulate every detail ("User X logged in", "Payment service returned error code 500", "Database connection timed out", etc.). When something goes wrong, one of the first troubleshooting steps is debugging with logs: you try to find any error entries or unusual messages around the time things broke.

So, the meme exaggerates a developer "consuming" all these logs at once. In real life, an engineer does this by using commands or tools to read the log files quickly. For example, a common technique is running tail -f on a log file, which streams new log lines to your terminal as they come in (almost like a live feed of what the app is writing). Another common action is using grep to search for keywords like "ERROR" or a specific transaction ID in the log text. If you've ever opened a large text file and scrolled through looking for something, you have a taste of this. Now imagine that, but at midnight, under pressure, and the text is cryptic computer gibberish – that's log diving during an incident.

Let's break down some key terms and elements:

  • Logs: These are text entries that applications produce to record their activities. They often include a timestamp, a level (INFO, WARN, ERROR), and a message. For example, a log line might look like:

    2023-01-06T02:42:17Z [ERROR] PaymentService - Unhandled exception: NullReferenceException
    

    This line tells us at January 6, 2023, 02:42:17 UTC, an error occurred in the PaymentService, specifically an unhandled exception. During debugging, an engineer would find a line like this and say "Aha! Something went wrong here." But to get to that line, they might have to read hundreds of lines around it to understand what led up to the error.

  • Production: The environment where real users are interacting with the software. It's contrasted with development or staging environments. Bugs in production are urgent because they affect real users or revenue. That’s why someone gets paged on-call to fix it ASAP, even if it's late.

  • Observability and Monitoring: These are practices and tools to keep an eye on systems. Monitoring usually refers to collecting metrics (like CPU usage, request rates, error counts) and setting up alerts (like "send an alert if error rate > 5%"). Observability is a broader term indicating how well you can understand the internal state of a system from its outputs. Logs are one pillar of observability (the other two are metrics and traces). In the ideal case, good observability means when an alert fires, you have dashboards or queries that directly point you to the issue, sometimes without reading raw logs.

  • On-call: A rotation system where engineers take turns being responsible for responding to any production issues. When you're "on-call," you carry a pager, phone, or have an alert system (like PagerDuty) set to notify you if something goes wrong. It's like being the firefighter on duty for the software – if a fire breaks out (server down, critical bug), you have to jump in and put it out. That often means troubleshooting live.

  • Troubleshooting with logs: This is a crucial skill. Early in your career, the first time you open a production log, it can be overwhelming. It's a big text with cryptic messages. A junior engineer might start by searching for obvious things like the word "ERROR" or looking at timestamps around when the incident happened. Over time you learn patterns: maybe a certain error always comes with a preceding warning, or a spike in the logs indicates high traffic, etc. It's a bit like reading a puzzle or mystery novel – you gather clues from different log lines to reconstruct what happened.

The visual of SpongeBob vacuuming up logs perfectly conveys the frantic energy of this process. His eyes are bulging – that’s the panic and focus. His mouth is wide open attached to a sack – that's like a dev opening a firehose stream of logs. White motion lines show it's fast and intense – similar to how an engineer might rapidly scroll through a log file or watch lines scroll by at high speed with tail -f. It’s frantic because during an outage, every minute counts (each minute might mean users can't use the service or the company loses money). So you really do sometimes speed-read logs, almost as if you could absorb them faster by sheer willpower.

The top caption "ME" simply means the person looking at the meme imagines they are SpongeBob. The bottom caption "LOGS FROM PRODUCTION" labels what SpongeBob is devouring. Many memes use this format to show a relationship, often one thing overwhelming or affecting another. Here it's showing the engineer being overwhelmed by log data.

For someone new: why is this funny? It's a bit of a stress comedy. In real life, gulping down logs isn't fun at all – it's stressful and tiring. But engineers joke about it to cope. It's funny in a cartoonish way: obviously no human can literally inhale information, but it feels like that's what we do during a high-pressure debug session. And SpongeBob (a goofy, lovable character) adds a layer of ironic silliness to a very un-fun real situation. Essentially, it's visualizing the feeling of "I have to take in all this information RIGHT NOW" in a humorous way.

Also, there's an implied critique: maybe we wouldn't have to do this if systems were easier to debug or if we had better tools. Modern logging tools (like Splunk, Kibana, Datadog) are meant to help by indexing logs so you can search them. But even with those, in a crunch, you're often doing the same logical thing the meme shows – grabbing as much log info as possible. ProductionIssues can be complicated, so engineers develop a kind of determination (or desperation) to gather every clue. It's almost like a treasure hunt, except the treasure is the cause of a bug and the map is scattered in the logs.

For a junior dev, the first few times on-call can be daunting. This meme, while funny, actually carries a bit of advice between the lines: be prepared to read logs and lots of them. It's a shared cultural joke that says "we’ve all been there, frantically parsing logs while half-asleep." So if you ever find yourself in that situation, know that it’s normal (if not ideal). And maybe next time you write code, you'll add a helpful log message or two – your future self might thank you during the next midnight debug!

Level 3: Drinking from the Firehose

At the senior engineer level, this meme hits home as a darkly comic snapshot of on-call life. We see SpongeBob (tagged "ME") furiously inhaling "LOGS FROM PRODUCTION" like he's chugging water from a firehose. In real dev terms, this is the engineer tailing logs and grepping through thousands of lines at 3 AM, trying to pinpoint why the system is on fire. The humor comes from the sheer absurdity and familiarity of the scenario: when a critical incident strikes in production, all our fancy dashboards, metrics, and structured observability pipelines often boil down to one desperate act – pulling every log line we can get and sifting for clues.

This combination of elements (a beloved cartoon character + a frantic action + a relatable caption) resonates with developers because it exaggerates a truth we know too well. The Observability_Monitoring tag hints that we should have graphs and alerts telling us exactly what's wrong. But the meme’s punchline is that, in reality, those systems usually just scream "something's wrong," and then it's up to an engineer to dive into the raw log data. It's a satirical nod to the gap between the promise of observability and the reality of incident response:

Ideal Observability 🛠️ On-Call Reality 🔥
Clear dashboard shows root cause at a glance One vague alert, then combing through log files manually
Clean, structured log search (e.g. in Kibana) returns answer in seconds grep -R "ERROR" on multiple servers, scrolling for ages
Alert at 2 PM when team is ready Pager wakes you at 2 AM, brain half functional
Issue fixed in 5 minutes 2 hours of log diving, working like a detective under pressure

The production environment is chaotic by nature – high load, real user data, complex interactions – and production logs reflect that chaos. A seasoned developer has probably survived "log overload" nights where you literally feel like SpongeBob gulping down an ocean of JSON, stack traces, and timestamped messages. Eyes bulging (like SpongeBob’s in the image) is no exaggeration after you’ve stared at a terminal for hours. The meme’s text “ME” and “LOGS FROM PRODUCTION” bluntly label the roles: it's you, the on-call engineer, versus an overwhelming torrent of log data.

From an industry perspective, this image satirizes how even in 2023 with advanced Observability tools, many teams still rely on brute-force log parsing during a crisis. It highlights an anti-pattern: Debugging_Troubleshooting by reading endless lines instead of having actionable alerts. Why does this keep happening? Often because setting up perfect monitoring for every failure mode is hard – systems are complex and unknown unknowns lurk. So when something breaks unexpectedly (and typically it’s not a simple bug you anticipated), logs are the last-resort source of truth. As the cynical veterans say, “When the dashboard fails, the log file prevails.”

The shared trauma here is real: any engineer who’s been on OnCallDuty has that memory of frantically scrolling or running tail -f on a log file while adrenaline fights off the 3 AM grogginess. The humor has a cathartic edge – we laugh because we've been there, hunched over a laptop, living off coffee and sheer willpower, essentially “frantic_log_consumption” incarnate. There's even a bit of pride implied with "like a champ": as miserable as it is, there’s a badge-of-honor vibe in surviving such a night. It’s a rite of passage in DevOps and backend engineering – you inhale those logs, find the needle in the haystack (maybe a freak exception or suspicious spike right before the crash), and save the day... or at least stop the bleeding before sunrise.

On a deeper level, this also touches on observability theory: logs are one of the three pillars (along with metrics and traces) that make a system observable. In a perfect world, we'd have structured logging, correlation IDs, and automated anomaly detection, so that the relevant log entries bubble up automatically. Many companies invest in centralized logging solutions (the ELK stack: Elasticsearch, Logstash, Kibana, or hosted services) to query logs efficiently. But even with those, when faced with a novel incident (productionIssues never seen before), engineers often fall back to brute-force tactics: dump all recent logs and comb through them. It’s the digital equivalent of checking every single log entry for clues. The meme nails the feeling: it's like trying to drink from a firehose – overwhelming and messy, yet that’s sometimes the only way to debug an elusive issue under time pressure.

Crucially, the meme also pokes fun at how on-call rotations can erode best practices: nobody intends to parse logs manually as a first choice. We all say we'll improve monitoring "when we have time," or that next sprint we'll add better error handling. But when the site’s down and alarms are blaring, you do whatever works now. That might mean opening a large log file (or 10), because the logs are the one place the system "talks" and spills its secrets about what went wrong. DebuggingPain is real – the code isn’t giving you answers, so you interrogate the logs like a detective interrogating witnesses. The image of SpongeBob “vacuuming” the contents of a sack is a perfect cartoon metaphor for how voracious and desperate this process feels. You’re effectively vacuuming up every bit of data for any hint of the culprit.

The caption style (bold all-caps labels) is a classic meme trope to assign roles. Here it's simple: SpongeBob = me (the engineer), Sack = logs from production. The visual exaggeration (SpongeBob’s wildly stretched mouth and the streaming white lines showing suction) mirrors the extreme data consumption. As a battle-hardened engineer, you might chuckle and think, "Yup, that was me last weekend, sucking down log lines and hoping to god I find the null-pointer exception before users wake up." The cynicism comes from experience: we've learned that no matter how many monitoring dashboards we set up, Murphy’s Law ensures the really nasty outage will require old-fashioned log spelunking.

In summary, at the senior level this meme is both a humorously exaggerated Observability case study and a gentle roast of our industry’s Production firefighting reality. It underscores the unsung heroism (and insanity) of late-night incident response. We laugh, we nod, and maybe we forward it to the team’s Slack with a grim smile, captioned: “us last night.” Because sometimes, to save the system, you have to become the log vacuum. And trust me, nothing builds character (or cynicism) like wrestling with production logs in the dead of night.

Description

The meme uses a screenshot from the SpongeBob SquarePants cartoon. SpongeBob is crouched on a green-planked floor, eyes bulging and mouth stretched wide as if vacuuming something out of a beige sack; white motion lines stream upward to exaggerate the frantic action. Over SpongeBob’s head is a bold caption in an all-caps black box that reads “ME.” At the bottom, another black box with white text reads “LOGS FROM PRODUCTION.” Visually, it conveys someone desperately consuming a torrent of data. Technically, it satirizes the reality that engineers often dive head-first into massive, chaotic log outputs while debugging production incidents or on-call pages, highlighting the overlap of observability, troubleshooting, and production firefighting
Comments

7
Anonymous ★ Top Pick Every quarter we spend six figures on “centralized observability,” and every 3 AM incident still ends with me tail -f | grep -i 'ohno' like a one-man log pipeline
  1. Anonymous ★ Top Pick

    Every quarter we spend six figures on “centralized observability,” and every 3 AM incident still ends with me tail -f | grep -i 'ohno' like a one-man log pipeline

  2. Anonymous

    After 15 years, I've mastered distributed tracing, structured logging, and custom dashboards, yet here I am grep-ing through 47GB of raw logs because someone forgot to add correlation IDs and now the CEO wants to know why checkout was slow for exactly one user at 3:47 AM

  3. Anonymous

    That moment when you grep production logs and realize the 'INFO' level messages you've been ignoring for months are actually masking a distributed transaction deadlock that's been slowly corrupting your event sourcing system - and the last person who understood this code left 18 months ago to become a goat farmer in Vermont

  4. Anonymous

    Nothing says enterprise observability like kubectl logs -f across the whole cluster while FinOps watches the Datadog bill autoscale

  5. Anonymous

    When prod logs hit like a firehose, proving your ELK investment was the real MVP - until the storage bill drowns you

  6. Anonymous

    At 3 a.m., prod logs are either a Kafka firehose of JSON you can’t grep, or the one line you need got sampled out and then GDPR’d

  7. @cringle_flex 3y

    Logs in production: fjfmbfjfbnfj, 1673015954

Use J and K for navigation