Claude AI Down But Status Page Says All Systems Operational
Why is this Observability Monitoring meme funny?
Level 1: Open Sign, Closed Store
Imagine you walk up to your favorite ice cream shop. The big neon sign in the window proudly glows “OPEN.” That’s like an invitation – come on in, everything’s normal! But when you try the door, it’s locked. Peeking inside, you see the lights are off and there’s a note on the door that says, “Sorry, we’re closed for now.” Confusing, right? The sign said one thing, but the reality was completely different.
That’s exactly the joke here. The website’s status page is like the shop’s neon “open” sign, saying “All Systems Operational” (everything’s fine!). But the actual website is the dark, locked store with a note saying it’s down. It’s funny (in a silly way) because of the contradiction: one part is confidently saying “no problems here!” while right behind it everything is clearly not okay. Even a kid can get why that’s goofy – it’s like a cartoon where a character declares “I’m totally okay!” while falling into a hole. The humor comes from the obvious mismatch between what we’re being told and what we can see with our own eyes.
Level 2: Status Page vs Outage
Let’s break down what’s happening here in simpler terms. We have two browser windows in the image:
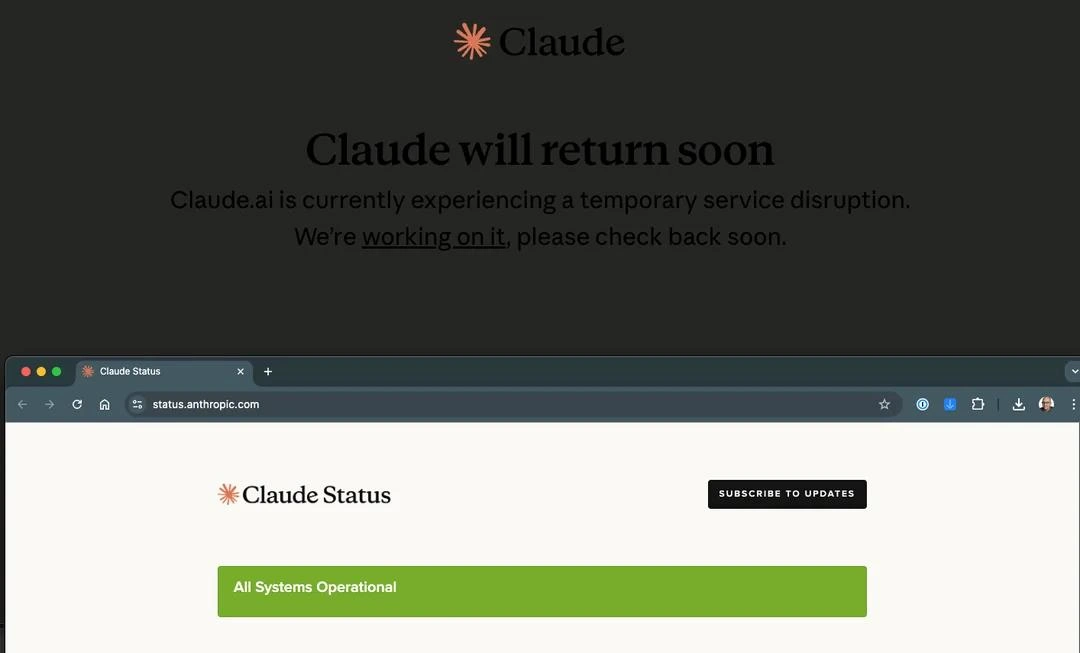
The first is the main Claude.ai site (a service by the company Anthropic, presumably providing an AI assistant named Claude). It’s dark, with a big message: “Claude will return soon. Claude.ai is currently experiencing a temporary service disruption. We’re working on it, please check back soon.” This is basically the site itself admitting “We’re down right now.” In tech terms, this is an outage or downtime message. The site is not functioning normally; users can’t get the service they want. The company is at least showing a notice saying “we know something’s wrong and we’re fixing it.”
The second window (in front) is a status dashboard at
status.anthropic.comtitled “Claude Status.” It’s bright and mostly empty except for a prominent green banner that says “All Systems Operational.” There’s also a button “Subscribe to Updates,” which is something users can click to get notifications if any issues are posted. A status page or status dashboard is a dedicated webpage (often separate from the main app) that a company uses to communicate the health of its services. Green typically means everything is okay, yellow might mean a partial degradation, and red means a serious outage. Here it’s all green — in other words, according to this dashboard, nothing is wrong.
Now the humor (and problem) is obvious: the main site is clearly down, but the status page is still saying everything is fine. For a junior developer or someone new to on-call issues, here’s why that situation occurs and why developers find it ironically funny:
Outage: This just means something went wrong in production (the live environment). It could be a server crash, a bug from a new deployment, a network issue — anything that causes the service (Claude, in this case) to not work for users. Outages are the fire-drills of the tech world.
Status Dashboard not updated: Ideally, the status page should flip to “Service Disruption” or some red/orange indicator as soon as an outage is confirmed. That update can be automatic (if monitoring systems detect the outage) or manual (someone on the team goes in and creates an incident on the status page). In this image, that obviously hasn’t happened yet. This could be because the monitors haven’t caught up or because no one pressed the update button.
Observability and Monitoring: These are the tools and systems that help engineers see what’s happening in their applications. Think of monitoring systems as automated watchers — they check if the site is responding, how slow or fast it is, error rates, etc. Observability is a broader term including logs, metrics, and traces that help you understand the system’s state. If observability is good, the team will quickly see that something’s wrong. But even if they know internally, that doesn’t automatically change the public status page (especially if that step is manual or has a delay). This meme is a classic case of a monitoring blindspot or a communication delay: the public view hasn’t caught up with reality.
On-Call Duty and SRE: You might have heard of on-call engineers or SREs (Site Reliability Engineers). These are the folks tasked with responding to production problems, often carrying a pager or phone that alerts them when something breaks. The categories here (OnCall_ProductionIssues, DevOps_SRE) tell us this meme is speaking to those experiences. If you were the on-call engineer when this happened, you’d be rushing to fix things — restart services, investigate causes — and also expected to inform users via the status page. When the status page stays green during an outage, it usually means the on-call team either hasn’t had a chance to update it, or possibly they’re still figuring out what’s going on. It’s a bit like the left hand not telling the right hand, even though both belong to the same body (the company).
Incident Communication Gap: This phrase means a delay or failure in communicating about an incident (outage) to users. It’s exactly what we see: a gap between the real incident and the official communication. Every minute the dashboard shows “Operational” while the site is actually down, users grow more confused and frustrated. It looks unprofessional, like the company doesn’t know its own system is broken. Developers joke about this because many have been in that stressful situation: users are yelling on Twitter, “Hey, your site is down!” and the engineer is scrambling to both fix the issue and update the darn status page. Sometimes you forget the latter until someone reminds you, “uh, the status page still says all good…” Oops.
In summary, the image is highlighting a disconnect between monitoring and reality. For a new developer, it’s a lesson: just because a dashboard says something is okay doesn’t mean it actually is. Always double-check and build systems that minimize this gap. The humor is in the absurdity — it’s like a fire alarm panel showing green (no fire) while the room is full of smoke. Everyone can see the problem except the indicator that’s supposed to tell you about problems!
Level 3: Monitoring Mirage
Anyone who’s been on On-Call Duty for production systems will likely chuckle (or cringe) at this scenario. The meme nails a classic DevOps/SRE horror story: the public-facing site is blatantly in an outage (with an apologetic message like “Claude will return soon”), yet the official status dashboard is still blissfully painted green with “All Systems Operational.” It’s a monitoring mirage — the tools that are supposed to inform users (and engineers) of issues are giving a false sense of security. This dark humor hits home because it’s a shared experience: Site Reliability Engineers (SREs) and DevOps folks have lived through incidents where the status_page_lies.
Why is this funny? Because it’s too real. It highlights an incident communication gap that many organizations struggle with. In theory, the moment a major ProductionOutage happens, either automation or an on-call engineer should update that status page to alert users. In practice, a few things often go wrong:
- Monitoring Blindspot: The monitoring system didn’t detect the problem in time (or at all). Maybe the health checks were pinging a shallow endpoint that still returns 200 OK, while the core functionality is broken. Or the checks might run every 5 minutes, so during that interval the dashboard stays green. This kind of monitoring_blindspot means the status page isn’t even aware it should turn red.
- Manual Lag: Many status dashboards rely on humans to update them during an incident. The on-call team is frantically trying to fix the issue (restart servers, roll back a bad deploy, investigate a spike in errors) and updating the status site might take a backseat for a few minutes. During that delay, users see a confusing disconnect. It’s not that the engineers want to keep it green; it’s that hitting the “incident update” button is easy to forget when alarms are blaring and people are yelling on a Zoom bridge.
- Policy and Denial: Sometimes there’s internal hesitation to mark anything red until fully confirmed. Management might say, “Let’s be sure what’s wrong before we scare customers.” Meanwhile, customers are already tweeting "Is Claude down?" because they got the disruption message. The incident_communication_gap widens as everyone upstream hesitates. By the time they flip the dashboard to “Major Outage”, users already knew – trust erodes, and the status page ends up looking like a joke.
- Separate Systems Issues: Often the status page is a separate system (for good reason – if your main product is down, you want status page up to communicate). But that can bite you if the integration between the two isn’t solid. Perhaps the main site failed to push an alert to the status system due to the outage (catch-22!), or the status site is on a third-party service that hasn’t yet noticed the drop. Ironic cases exist where the status page itself experiences an update failure (or even an outage of its own). So you get a green light simply because the failure in communication makes the dashboard think everything is fine, a dashboard_green_while_down situation.
For seasoned devs, this meme triggers a knowing grin (and maybe a PTSD flashback). It’s the absurdity of having your observability and monitoring tools – the ones meant to assure everyone – completely misrepresent reality. We’ve all hammered F5 on a status page waiting for it to turn red while the evidence of a problem was already all around. It’s funny in the same way as a fire alarm that’s happily silent during a blaze: objectively it’s a serious failure, but the sheer ridiculousness can make you laugh (probably after the fact, once the outage is resolved and you’ve had some coffee).
The meme text “Claude will return soon” versus “All Systems Operational” is basically the DevOps version of “the house is on fire, but the official report says ‘situation normal.’” This kind of humor resonates because it underscores the disconnect between observability ideals and real-world ProductionIncidents. It’s a gentle (or not-so-gentle) ribbing of every DevOps_SRE team’s nightmare: when your carefully crafted dashboards and status pages provide false confidence. And as the Cynical Veteran in us might say with a smirk: "Of course all systems are operational... except the one actually serving customers, but who’s counting?"
Level 4: Eventually Consistent Outage
On a theoretical level, this meme exposes an eventual consistency problem in the world of observability. The main site and the status dashboard are essentially two separate distributed systems (or at least separate services) that have become out-of-sync. Consider the status page as a read-replica of the system’s health: it doesn’t reflect the latest "write" (the outage) until some propagation delay or manual update occurs. In distributed systems theory, if you prioritize availability of the status page (it stays up no matter what) and partition tolerance (it’s hosted separately so it’s not taken down by the main site outage), you often sacrifice consistency of data between systems. This is reminiscent of the CAP theorem in an unintended way: the status site remains available during the partition (the outage of the main site), but the information it presents isn’t consistent with reality. The result is a stale read: a bright-green "All Systems Operational" banner that was true an hour ago but is now a lie.
From a systems design perspective, monitoring data has refresh intervals and detection thresholds. If the monitoring system hasn’t polled or been fed the failure info yet, it will keep reporting the last known good state (green) — just like a caching mechanism that hasn’t received an invalidation. Some status dashboards are updated by automated health checks that run every N minutes, or they rely on heartbeats (ping) from the service. If the failure happened between heartbeat intervals or if the monitoring agent itself is affected by the outage, you get a window where the site is down but the dash is all green. In other words, the status indicator is eventually consistent with the actual system state, but not immediately consistent. That lag is where the comedy (and horror) lives.
There’s also a hint of a Byzantine failure vibe: one part of the system (the site) knows it's in trouble, but the component responsible for telling everyone (the status page) is blissfully unaware, effectively behaving like a faulty node broadcasting incorrect state. Achieving a single source of truth in real-time is hard — especially when your "truth" has to travel across systems or through human processes. Robust observability systems try to reduce this window of inconsistency with multi-layer checks, cross-regional monitors, and push-based alerts. But in practice, even the best dashboards can momentarily lag behind the ground truth. The meme humorously illustrates this fundamental challenge: the truth of an outage eventually catches up, but until then users are stuck in a weird limbo where the site is screaming “I’m down!” while the status page smiles and says “All good here!”.
Description
Two-part screenshot meme. Top half shows Claude.ai's error page with the Anthropic logo and message: 'Claude will return soon. Claude.ai is currently experiencing a temporary service disruption. We're working on it, please check back soon.' Bottom half shows a browser tab open to status.anthropic.com (Claude Status page) with a green banner proudly declaring 'All Systems Operational.' The juxtaposition highlights the classic disconnect between a service being visibly down for users while the official status page claims everything is fine -- a universal experience with cloud service providers
Comments
10Comment deleted
Schrodinger's SLA: the service is simultaneously down for every user and 100% operational according to the status page. The green checkmark is load-bearing -- if it turns red, two more services go down from the alert storm
Our monitoring system is so reliable, it has a 100% uptime guarantee, even when the services it's monitoring don't
When your homepage and your status page disagree, you’ve achieved distributed consensus - just not on the truth
After 20 years in tech, I've learned that 'All Systems Operational' on a status page is just the monitoring system's way of saying 'I haven't checked recently, but last time I looked everything was fine' - kind of like how your health check endpoint returns 200 OK right before the OOM killer visits
Ah yes, the classic 'All Systems Operational' green banner while users stare at a 503 error page - a perfect demonstration of Schrödinger's service: simultaneously up and down until an engineer checks the actual logs instead of the dashboard. This is why seasoned SREs have trust issues with status pages and maintain a separate monitoring stack to monitor the monitoring stack. The real question is: did the status page fail to detect the outage, or is it technically correct because the status page itself is operational? Either way, someone's on-call pager is about to have a very bad time, and the post-mortem will include the phrase 'improved observability' at least seventeen times
Nothing like an SLO defined as "status endpoint returns 200" - guarantees 99.99% while users stare at "Claude will return soon."
Status page: 'All green!' - because monitoring the outage detector wasn't in the SLA
Split-brain: the app is down, but the status page’s CDN cache - with a generous TTL - stays blissfully green; apparently our most reliable service is “All Systems Operational.”
Vibe-coded status page 👍 Comment deleted
😂 Comment deleted