
Log Spike Hides .env Scan Meme Explained
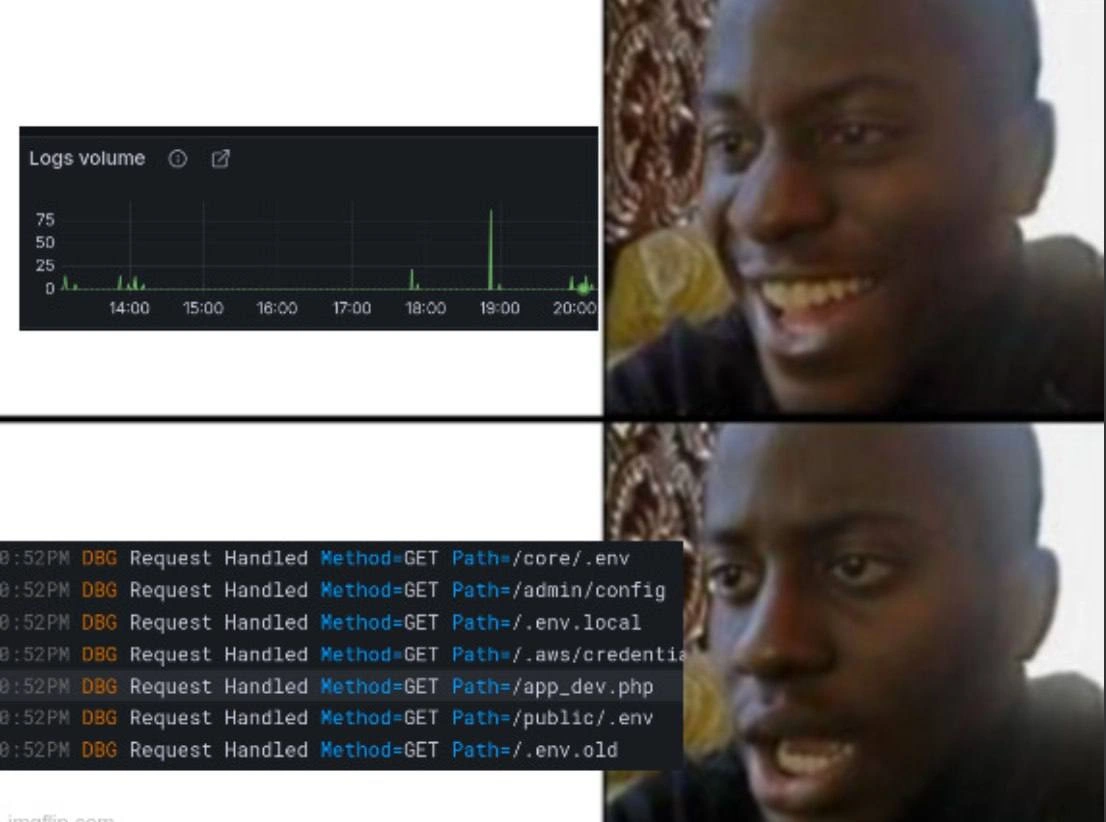
Top panel: a smiling on-call engineer shrugs at a single logs-volume blip. Bottom panel: the same face horrified after reading debug lines probing .env, .aws/credentials, and config paths. The dive covers crawler attacks, secrets exposure, and why metrics alone miss context.
Level 1: The Cookie Jar Clue
Imagine you wake up and see one cookie crumb on the kitchen counter. You grin, thinking maybe someone had a little midnight snack – no big deal. But then you open the cookie jar and… all the cookies are gone! 🍪😱 That one tiny crumb was the only sign that something sneaky happened. Suddenly you’re not smiling anymore, right?
In this meme, the little spike in the graph was like that one crumb. It looked small and harmless at first. The engineer was like, “Everything’s probably fine.” But when they checked the logs, it was as if they discovered the empty cookie jar – a shock. The logs showed someone (a bad computer robot) quietly tried to peek into all the secret hiding spots (the .env files are where secrets are kept, kind of like the cookie jar of secrets). So the engineer’s face went from happy to horrified. It’s funny in the way a surprise can be – first you think nothing’s wrong, then you realize something bad almost happened. Just like noticing a crumb and realizing a cookie thief came in the night, that tiny log spike was the clue that an attacker came snooping around in the server.
Level 2: Lurking in the Logs
Let’s unpack the situation in simpler terms. The top image is a small monitoring graph (from a tool like Grafana) showing the number of log entries over time. Most of the day looks flat and quiet, but around 19:00 there’s a single tall spike. That means at that time, the application suddenly logged a bunch of events and then went back to normal. The man’s happy face represents the engineer thinking “Eh, probably nothing major.” This often happens when you’re on on-call duty (being responsible for handling issues off-hours): you see a tiny anomaly and hope it’s harmless.
Now, the bottom image reveals the actual log entries during that spike. Log lines are records of events that happened on the server. These ones are in a debug (DBG) level log, each showing an HTTP request handled by the server. They look like this:
19:52:01 DBG Request Handled Method=GET Path=/core/.env
19:52:02 DBG Request Handled Method=GET Path=/admin/config
19:52:02 DBG Request Handled Method=GET Path=/.env.local
19:52:03 DBG Request Handled Method=GET Path=/.aws/credentials
19:52:04 DBG Request Handled Method=GET Path=/app_dev.php
19:52:05 DBG Request Handled Method=GET Path=/public/.env
19:52:06 DBG Request Handled Method=GET Path=/.env.old
Each line has a timestamp (in 24h format, 19:52 is 7:52 PM), a log level (DBG for debug), and details of the request: the HTTP method (GET) and the path that was requested on the server. All these requests happened one after another, within a few seconds. That’s a huge red flag – it suggests an automated script or bot rapidly trying different URLs on the site. No normal user clicks through a site that fast or tries those strange paths.
Notice all the paths it tried are suspicious and related to configuration or secret files:
| Requested Path | What Is It? (Why It’s Sensitive) |
|---|---|
/core/.env |
A possible location of a .env file (environment config). Could contain database passwords, API keys, etc. Exposing this would be very bad. |
/admin/config |
Likely an admin configuration page or file. If unprotected, it might give away settings or allow changes. (Legitimate users shouldn’t be hitting this directly without authentication.) |
/.env.local |
Another common environment file (often used for local or specific environment overrides). Would also contain secrets. |
/.aws/credentials |
The file where AWS stores access keys on a server. If an attacker gets this, they gain access to your Amazon Web Services account – basically keys to your cloud kingdom. 🔑 |
/app_dev.php |
A development mode script (in frameworks like Symfony, app_dev.php enables debug mode). On a production server this should be removed or disabled. If accessible, it can reveal a lot of internals and config. |
/public/.env |
An environment file inside a public web directory. This would be a mistake, but if it’s there, it’s visible to the world. Contains the same sensitive stuff – secrets and config. |
/.env.old |
A backup or old copy of an env file. Developers sometimes rename old config files to .env.old. It still contains secrets, and if left on the server, it’s an easy target. |
In plainer terms, environment (.env) files usually hold configuration settings and secrets for an application – things like database login credentials, API tokens, or encryption keys. These files are supposed to be kept private on the server and never sent to users. The fact that a client out on the internet is requesting them is a big sign of malicious intent. No regular user would ever have a reason to directly fetch “/.aws/credentials” from a website, for example! This is clearly a crawler bot going through a predefined list of juicy filenames, hoping to get lucky and find a website that accidentally left one of these sensitive files accessible.
Why would such a mistake happen? Sometimes inexperienced developers deploy an app in a hurry and forget to adjust the server settings. For instance, web servers like Apache or Nginx usually block "dotfiles" (files starting with a dot like .env) from being served to the public. If that configuration is missing or misconfigured, a .env file sitting in the web directory might get served like a regular webpage – which is a serious security vulnerability. Similarly, leaving a file like app_dev.php on a production server is an oversight that could open a backdoor to attackers.
The engineer’s reaction in the meme goes from calm to shocked because they realized that this spike wasn’t harmless at all – it was actually an attack attempt. The smiling face is “Looks like just a tiny blip in log volume, nothing to worry about.” The horrified face is “Oh no, those logs show someone trying to steal our secrets!” 😱 It’s the moment of understanding that what looked like a random fluctuation is actually a potential breach in progress. If any one of those requests had succeeded (for example, if /.env was accidentally accessible), the attacker would have downloaded that file and possibly gotten database passwords, API keys, or other private data. In other words, that small log spike could mean a huge security incident if not caught in time.
This scenario is very realistic in production environments. Attack bots are constantly scanning websites for common vulnerabilities. It’s not personal – they just crawl the internet looking for any server that responds. When you run a server, you’ll often find weird log entries like requests for admin.php, config.php, .git/, .env, etc., even if you never created those files. These are automated scripts checking if your site has low-hanging fruit they can grab. Experienced developers and DevOps folks learn to recognize these patterns. They set up alerts or security tools (like a SIEM – Security Information and Event Management system) to catch such behavior. For example, a SIEM rule might trigger an alarm if it sees a sequence of requests for .env or AWS credential files, because that’s almost surely an attacker, not a normal user.
For a newer developer or someone not familiar with server logs, let’s clarify some terms from the meme:
- Logging: Applications record events (like requests, errors, or debug information) to log files. These logs help developers understand what’s happening under the hood.
- Observability & Monitoring: Tools like Grafana or Kibana let you visualize data from logs or metrics. In the meme, the “Logs volume” panel is showing how many log entries occurred each minute/hour. Observability means you can observe the internal state of your systems by looking at charts, logs, etc.
- Production: This means the live environment where real users are using the system (as opposed to a development or test environment). A production incident is something going wrong on the live site.
- On-call: A rotation where a developer/engineer is responsible for responding to issues at any time (often outside regular hours). If you’re “on-call” and an alert or anomaly happens, you have to investigate.
- Sensitive Data Exposure: A security risk where secret information (like passwords or keys) gets exposed to unauthorized people. The
.envfile and AWS credentials are considered extremely sensitive. If these are leaked, it’s game over – the attacker could access databases or cloud services. - Secrets Management: The practice of keeping secrets (passwords, keys) safe – e.g., storing them in secure vaults, not hardcoding them or leaving them in files that can leak. This meme essentially shows a failure of secrets management if those files were accessible.
So, in summary, the meme’s bottom panel is showing a debug log output that reveals a rapid series of suspicious requests. The top panel’s graph treated that event as just a numeric spike, but the detailed logs show it was actually an attacker scanning for private config files. The engineer thought everything was fine until they looked deeper – a classic case of “small symptom, big problem.” The humor here is a bit of an inside joke: people who have been on-call or dealt with production security scares find it funny because it’s true. A minor-looking log spike can hide a major threat. The meme is both a warning (take strange log entries seriously!) and a bit of commiseration among developers and ops folks – we’ve all had that “oh no...” moment when digging through logs.
Level 3: The Blip Before the Breach
At first glance, that Grafana "Logs volume" graph looks tame – just a tiny green spike around 19:00, nothing to panic about. The on-call engineer is smiling in relief, thinking the system is calm. But seasoned devs know a lone spike can be the harbinger of doom. In the bottom panel, reality hits: the logs show a malicious crawler systematically poking at every secret-storing file in the app. The humor (and horror) comes from the drastic contrast – a seemingly innocent blip versus a full-blown security incident quietly unfolding. The meme captures that gut-sinking moment every SRE or DevOps veteran recognizes: "Everything looked fine... until I checked the logs."
Let's break down why this is darkly funny to experienced folks: an automated bot was trying to fetch every .env file and config in production. Those log lines – GET /core/.env, GET /admin/config, GET /.env.local, GET /.aws/credentials, and even GET /.env.old – are like a greatest hits list of sensitive files that should never be exposed. It's a crawling scanner going through a checklist of known secret stash locations. The on-call engineer’s happy face in the top-right turns to pure terror in the bottom-right because they recognize what those requests mean: someone is trying to pry into every door and window of our system.
From a senior perspective, this meme nails the on-call nightmare: a trivial-looking metric was actually an attacker probing for weaknesses. The one-spike graph is deceptively chill – no long outage, no flood of errors – but that’s exactly why it’s dangerous. It’s the quiet ones you worry about. In this case, the "quiet one" was a quick burst of log entries that could easily slip past detection. An inexperienced on-call might have shrugged it off, but a battle-hardened engineer knows to zoom in on that spike. Sure enough, the logs reveal a bot scraping for config files: .env files (which hold environment secrets like DB passwords and API keys), an AWS credentials file, old backups – basically all the juiciest secret files a careless deployment might leave accessible.
Why is this funny in a painful way? Because it’s so common and so preventable, yet it still happens. Everyone preaches "don’t commit secrets, don’t deploy .env in web root," and yet attackers still try, and occasionally succeed, in grabbing these files. It’s gallows humor: the smiling face is us ignoring a small anomaly, and the horrified face is also us two minutes later when we realize that anomaly was an active break-in attempt. The meme is a wink to all those late-night incident responders: you know that 3 AM “minor alert” that turned out to be a big deal? Yep, this is it.
On the Observability side, it highlights a monitoring blind spot. A log volume graph won’t tell you what was in the logs – only how many. Fifty harmless 200 OK requests and fifty hack attempts look identical on that green graph. The senior on-call folks learn to always check context. Perhaps a well-tuned security alert (hello SIEM dashboards 👋) would have flagged “someone tried to GET a .env file” immediately. But if you rely just on high-level metrics, you can miss the subtle signs of an ongoing breach attempt. The humor comes from experience: we’ve all been that optimistic person lulled by stable graphs, only to find out the logs were hiding a burglar. It’s a mix of “there but for the grace of good configuration go I” and “I’ve seen this movie before, and it doesn’t end well.”
In short, the meme speaks to the paranoia that seasoned engineers develop. That innocent spike was actually an attacker’s shopping list of secret files. The first panel’s blissful ignorance and the second panel’s abject horror reflect the rollercoaster of on-call life. It’s funny because it’s true: sometimes a tiny blip in your monitoring dashboard is actually someone banging on the vault door, and your realization comes a few log lines too late.



That's not user engagement, that's a free, unsolicited penetration test from a script kiddie who thinks '/.env' is the new 'hello world'
Nothing like a 19:00 ‘harmless’ spike to remind you that `.aws/credentials` isn’t meant to double as a public REST endpoint
The real horror isn't the 75 requests per second spike - it's realizing your junior dev's 'temporary fix' of chmod 777 on the project root from six months ago is still in production, and now someone's downloading your AWS keys faster than you can rotate them
That moment when your log volume graph looks like a hockey stick and you realize someone's running a directory enumeration script against your production API - and your .env files are responding with 200 OK. Nothing says 'Friday evening' quite like watching attackers systematically request every possible secrets file path while your monitoring dashboard lights up like a Christmas tree. At least the observability stack is working perfectly to document your impending PagerDuty incident and inevitable post-mortem titled 'Why Our AWS Credentials Were Briefly Public.'
Config management so distributed across /env paths, it's a CAP theorem violation - consistent leaks, available everywhere, but partitioned by dev negligence
That 'Logs volume' spike wasn’t growth; it was the internet’s nightly cron GETting /.env and /.aws/credentials - why are we alerting on volume instead of 2xx to sensitive paths?
If your WAF lets GET /.aws/credentials through, you don’t need chaos engineering - you’re already running adversary-driven failure injection
HTTP 404 GET /phpinfo HTTP 404 GET /.env HTTP 404 GET /.git 🥱 HTTP 200 GET /phpinfo HTTP 200 GET /.env HTTP 200 GET /.git 💀
WAF idea: return fake but seemingly legitimate responses for those paths. That way you trick the attackers!
They just wanted to get ready to add a few lines to your source code 🥰
A couple years back I got into algotrading crypto, made a bot, rented a VM and deployed it. I don’t remember exactly why it needed an API, but it had one, so, naturally, it was accessible through the web. I deployed it on DigitalOcean and saw lots of these types of logs of people trying to find vulnerabilities. What’s interesting is when I deploy anything on Russian cloud providers, I don’t have any such traffic 🤪
Even though I didn’t advertise my bot to anyone while the stuff I have on Russian clouds is a literal SaaS with thousands of users
Nah, most of it was Turkey, Portugal and South America
Turkey was surprisingly big one
/restore.php
or... put fake .env files
and enter in loophole
Does it still work anywhere?
what hackers gonna do if they steal my source code? Debug it?
😂