
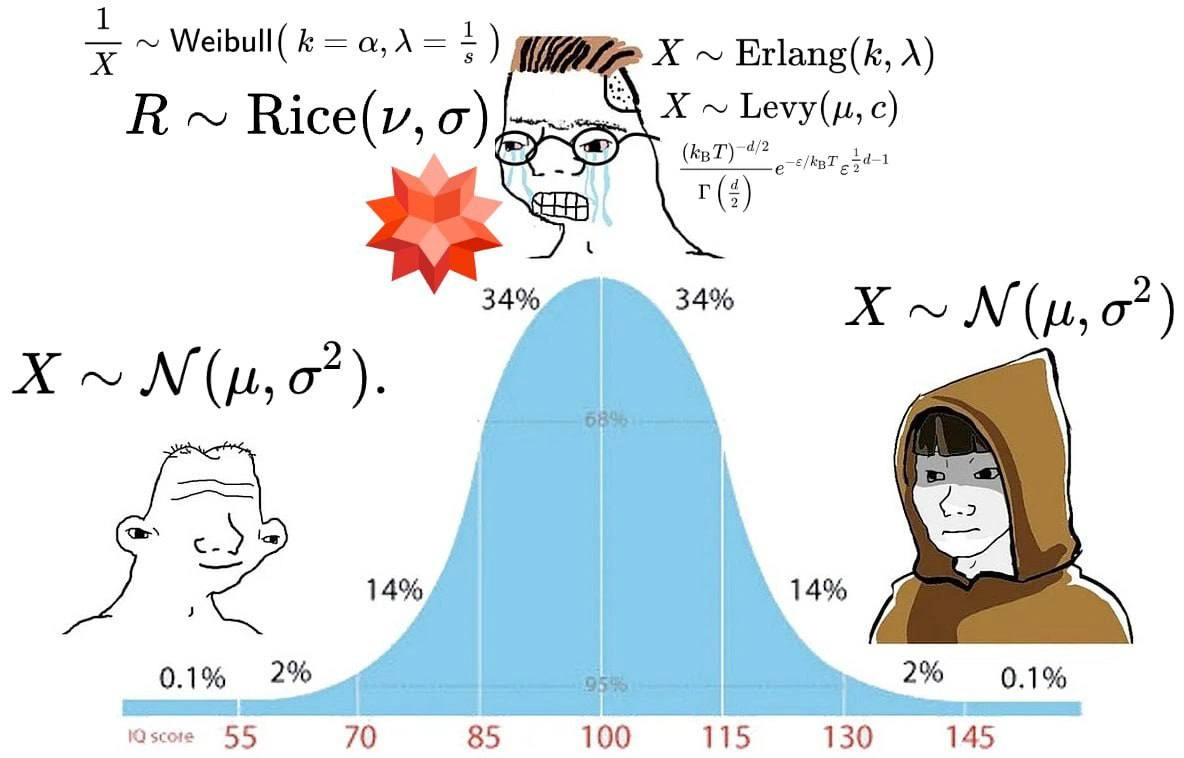
The Bell Curve of Statistical Model Complexity
Description
This meme uses the IQ Bell Curve (or 'Galaxy Brain') format to comment on statistical knowledge. It displays a blue normal distribution curve with an x-axis labeled 'IQ score'. At the low-IQ left tail (0.1%-2%), a simple Wojak character ('Brainlet') is shown next to the formula for a normal distribution, 'X ~ N(μ, σ²)'. At the high-IQ right tail (2%-0.1%), an enlightened, monk-like Wojak is shown next to the exact same formula. In the center, representing the majority with average intelligence (the 'midwit'), a crying, glasses-wearing Wojak is overwhelmed by a chaotic list of complex probability distributions and formulas, including 'Weibull', 'Rice', 'Erlang', 'Levy', and the Maxwell-Boltzmann distribution. The joke illustrates the Dunning-Kruger effect in a technical context: beginners and true experts appreciate the power and applicability of the fundamental normal distribution, while those with intermediate knowledge often get lost in esoteric, overly complex models, mistaking complexity for sophistication


Comments
17Comment deleted
The junior data scientist uses a normal distribution. The mid-level one insists on a Bayesian hierarchical model with a custom prior they can't justify. The principal scientist uses a normal distribution, but after spending a week proving the Central Limit Theorem holds for their specific use case
Senior data engineers know the real distribution in prod is ‘whatever passes the acceptance test’ - but a quick 𝒩(μ, σ²) gets them back to lunch before the midwit finishes typing Γ(d/2)
The true bell curve of software architecture: juniors and staff engineers both reach for simple solutions while the mid-levels are deriving the closed-form solution to the gamma function of their microservice mesh topology
The real senior architect move: spending three sprints researching exotic probability distributions for your load balancer, only to realize the default exponential backoff was fine all along. Sometimes the junior's 'just use normal distribution' isn't naivety - it's wisdom you'll rediscover after implementing Rice-Rician fading models for your HTTP retry logic
Career-level take: junior assumes Gaussian, midcurve fits Erlang/Weibull/Levy to everything, principal ships percentiles with bootstrapped CIs - because nothing in prod is normal even if the slide still says X ~ N(μ, σ²)
Rice for the RFP, Gaussian for prod SLOs - because stakeholders love bells, not tails
We swear service times are Erlang and outages are Levy, but the only distribution that survives OKRs, dashboards, and CFO reviews is N(μ, σ²)
That IQ < 55 guy she tells you not to worry about... Comment deleted
This should have been text under the image 🌚 Comment deleted
On a side note, I really need to refresh my memory on math... Any good sources for a dev that has distanced himself from math for a few years? Comment deleted
Mathematics and Calculus, George B. Thomas Comment deleted
1000+ pages 😬 thanks though I guess I'll just read some pages at a time Comment deleted
introduction book in a nutshell 😂 1000 page+ Comment deleted
Coupla years ago there was app called "brilliant" that let one learn a lot of stuff in practical way, but dunno how advanced it got vs how advanced you want Comment deleted
The YouTube sponsor thingy? I specifically avoid anything that does sponsorships on YouTube. It hasn't failed me. Thanks for the suggestion though Comment deleted
you mean app for site brilliant dot org? Comment deleted
Introductory Real Analysis by Kolmogorov Comment deleted