

Developers Fighting COVID-19, One Map Tracker at a Time
Description
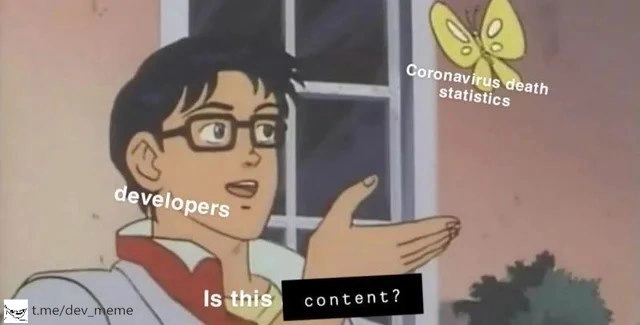
A two-panel meme featuring the character Bugs Bunny in a pink jacket and a large blue hat. In the top panel, Bugs is leaning back with a smug, confident expression, with the text overlay: 'programmers, trying to come up with a solution to help fight corona virus'. In the bottom panel, Bugs is shown firing a pistol with a puff of smoke, alongside the text: '*makes another COVID-19 world map tracker*'. A watermark for 't.me/dev_meme' is visible in the bottom left corner. This meme satirizes a major trend from early 2020 where the developer community, eager to contribute to the pandemic response, produced a massive number of COVID-19 case tracking dashboards and maps. The humor lies in the contrast between the grand ambition of 'fighting the virus' and the common, often redundant, outcome of yet another data visualization project. For senior engineers, it's a relatable commentary on tech 'solutionism' and the tendency for developers to gravitate towards familiar, achievable projects rather than tackling the much harder, systemic problems

Comments
7Comment deleted
We wanted to flatten the curve, but we ended up just plotting it on another Vega chart
March 2020: when every senior dev vowed to “help humanity” and, 48 hours later, shipped a React + D3 choropleth hammering the same Johns Hopkins CSV - proving that rate-limited APIs flatten enthusiasm curves too
Nothing says "I'm making a difference" quite like being the 47th person to wrap Leaflet.js around the Johns Hopkins API and call it a hackathon winner
Ah yes, the great COVID dashboard gold rush of 2020 - when every developer suddenly became an epidemiologist armed with Leaflet.js and a public API. Nothing says 'solving a global crisis' quite like the 47,000th implementation of a choropleth map pulling from the same Johns Hopkins dataset. At least we all got that sweet GitHub contribution graph boost while the world burned
When leadership asked how we could fight COVID, the design review produced five microservices, a cron scraping a Google Sheet, and a D3 choropleth - because when all you have is React and Mapbox, every public health problem looks like a dashboard
Reinventing the wheel, one choropleth clone at a time - because JHU CSVs deserved a million React dashboards
Because curing COVID was hard, we did the senior thing: ship a “real‑time” React+Mapbox choropleth - eventually consistent data, immediately consistent applause