
The Slow, Incremental Crawl of AI in Software Engineering
Description
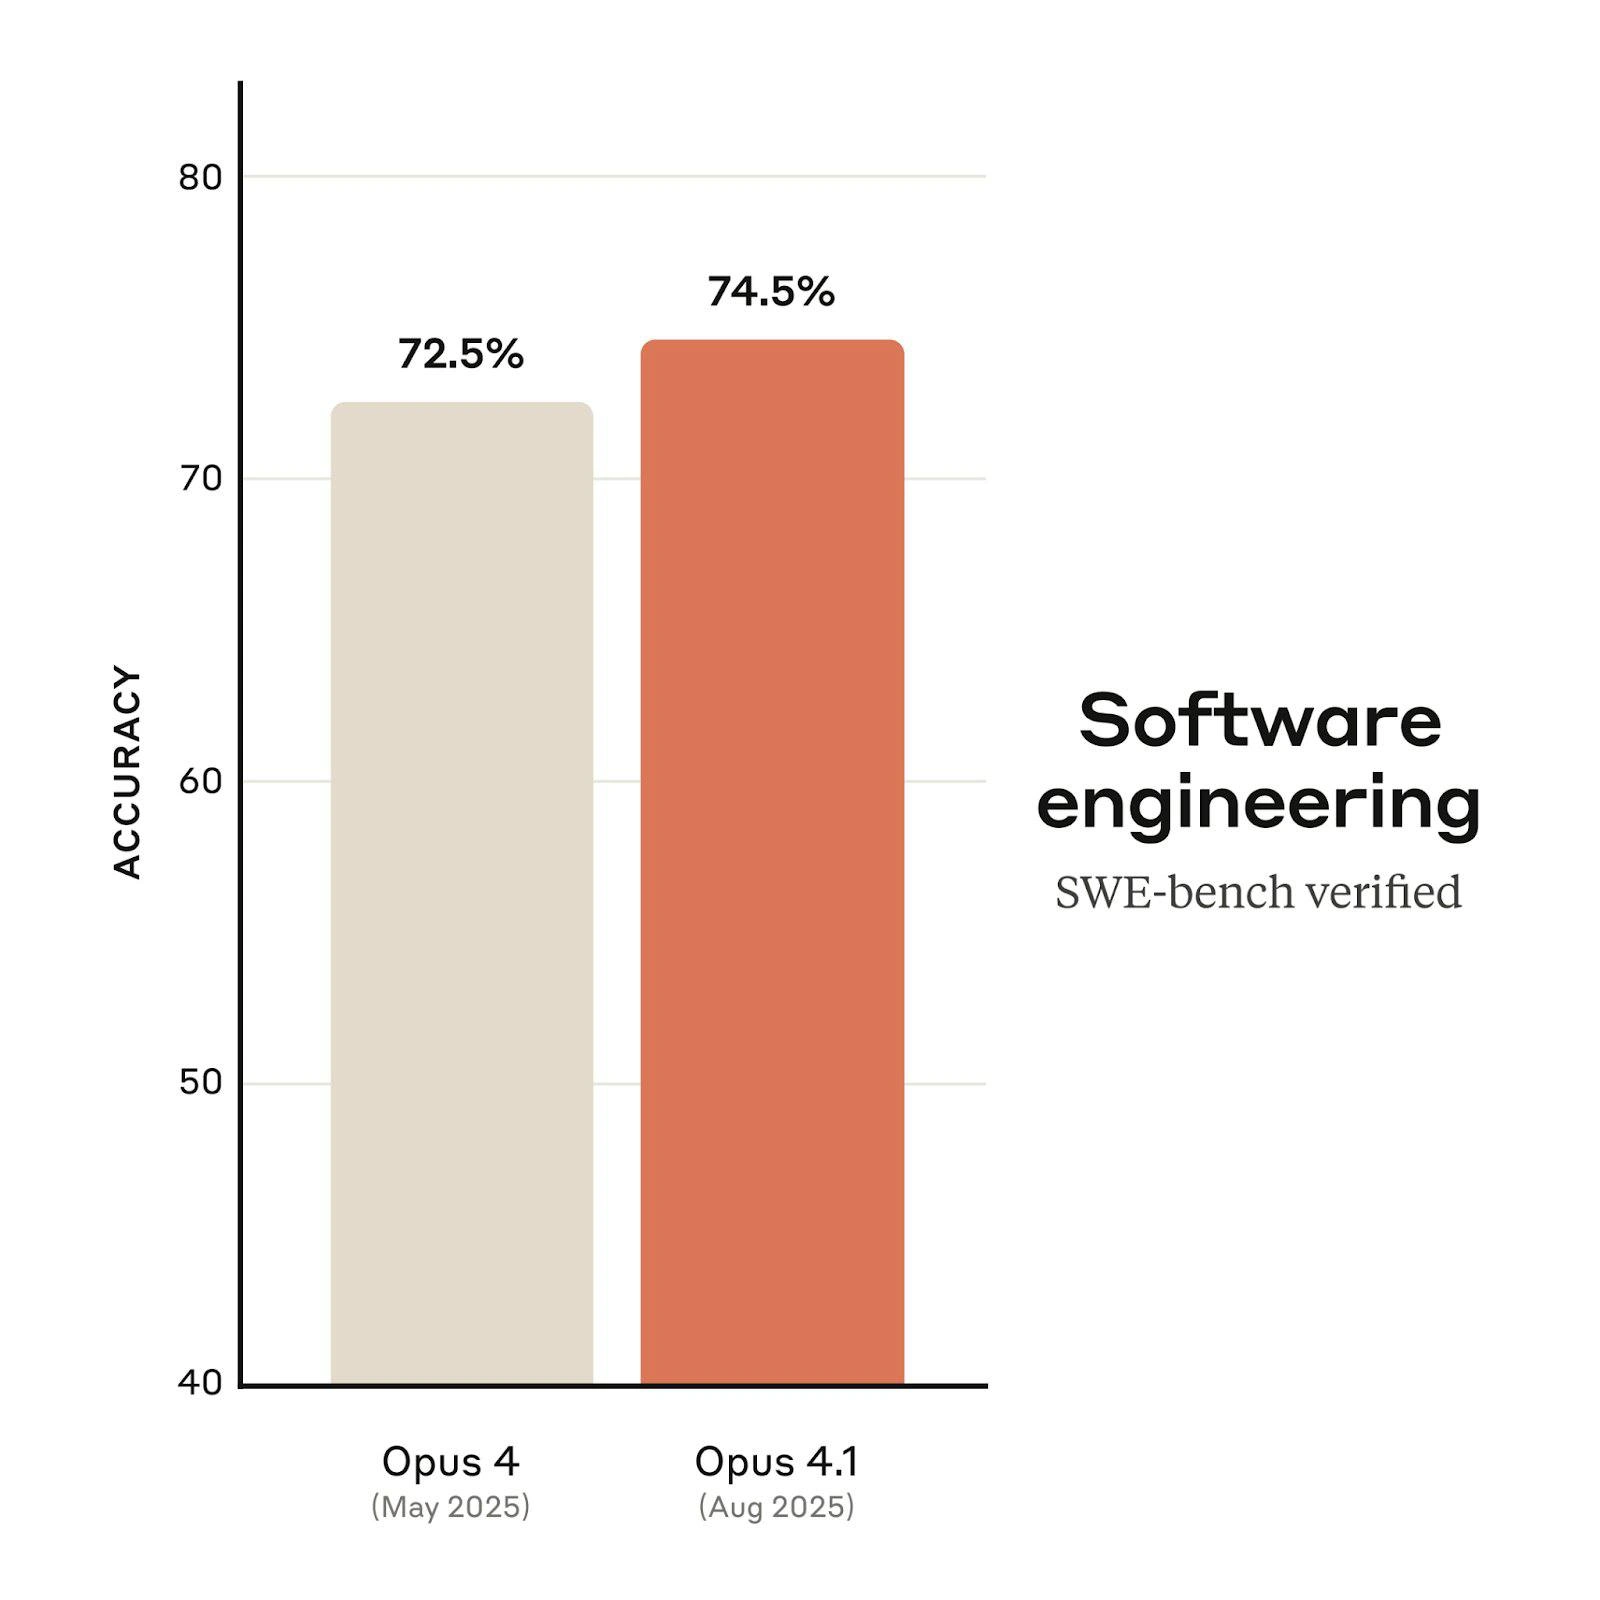
A minimalist bar chart on a white background illustrates the performance of an AI model on a software engineering task. The y-axis is labeled 'ACCURACY'. Two vertical bars are shown. The first, a light beige bar, represents 'Opus 4 (May 2025)' and reaches an accuracy of 72.5%. The second, a slightly taller terracotta-colored bar, represents 'Opus 4.1 (Aug 2025)' and shows an accuracy of 74.5%. To the right of the chart, the text reads 'Software engineering' and 'SWE-bench verified'. The image visualizes a small, incremental improvement of 2 percentage points over three months. This chart provides a dose of realism for the senior developer audience. While the hype around AI suggests revolutionary leaps, this data from a respected benchmark like SWE-bench (which tests AI on real GitHub issues) shows the hard-won, gradual nature of progress in automating complex software engineering tasks. It's a subtle nod to the immense complexity of the domain, where even minor gains are significant achievements



Comments
17Comment deleted
A 2% accuracy boost on SWE-bench in three months. Great, at this rate the AI will be qualified to confidently close a 'won't fix' ticket by 2028
Sure, it’s only a 2 % lift - but it’s still the most productive junior dev I’ve onboarded this decade
After three months of training and probably millions in compute costs, Opus 4.1 proudly announces it can now solve 2% more LeetCode problems - still leaving a solid 25.5% chance it'll suggest using a bubble sort in production
When your Q3 OKR was 'ship Opus 4.1 with breakthrough performance' and you deliver a 2% bump that took three months, $10M in compute, and 47 ablation studies - but hey, at least the bar chart makes it look like we're crushing it on the logarithmic scale of executive expectations
Nice, +2% on SWE-bench; wake me when it can bisect a flaky test in a 500k-line monorepo, dodge CI secrets, and still pass after cache invalidation
A patch release that literally patches ~2% more SWE-bench bugs - ping me when that delta survives the confidence interval and a Friday deploy
2% gain in three months: enterprise velocity at its finest - even AIs can't escape quarterly planning
A leap Comment deleted
Damn Comment deleted
make the graph start from 70% and you’ll see the shareholder magic Comment deleted
Make it start from 72 Comment deleted
But in any case 8% improvement is pretty good for 3 months Comment deleted
For top model But idk how to trust all those charts Tho Antropic is only one who’s left in the field to whom you can trust that they actually have progress So idc about charts They pushed new version, I gonna simp it Comment deleted
What does these percentage mean btw? What is 100%? Comment deleted
graph says accuracy, so I assume it's a percentage of tasks solved correctly Comment deleted
Interesting... Actually, they can get any tasks (very easy for example) and say that the new model has 100% accuracy🤔 Comment deleted
Isn't it what AI should be best used for — to solve routine, primitive tasks that nobody wants to spend their time on? Comment deleted